Okinawan vs Latvian Unemployment
COMPARE
Okinawan
Latvian
Unemployment
Unemployment Comparison
Okinawans
Latvians
4.9%
UNEMPLOYMENT
97.9/ 100
METRIC RATING
78th/ 347
METRIC RANK
4.7%
UNEMPLOYMENT
99.9/ 100
METRIC RATING
25th/ 347
METRIC RANK
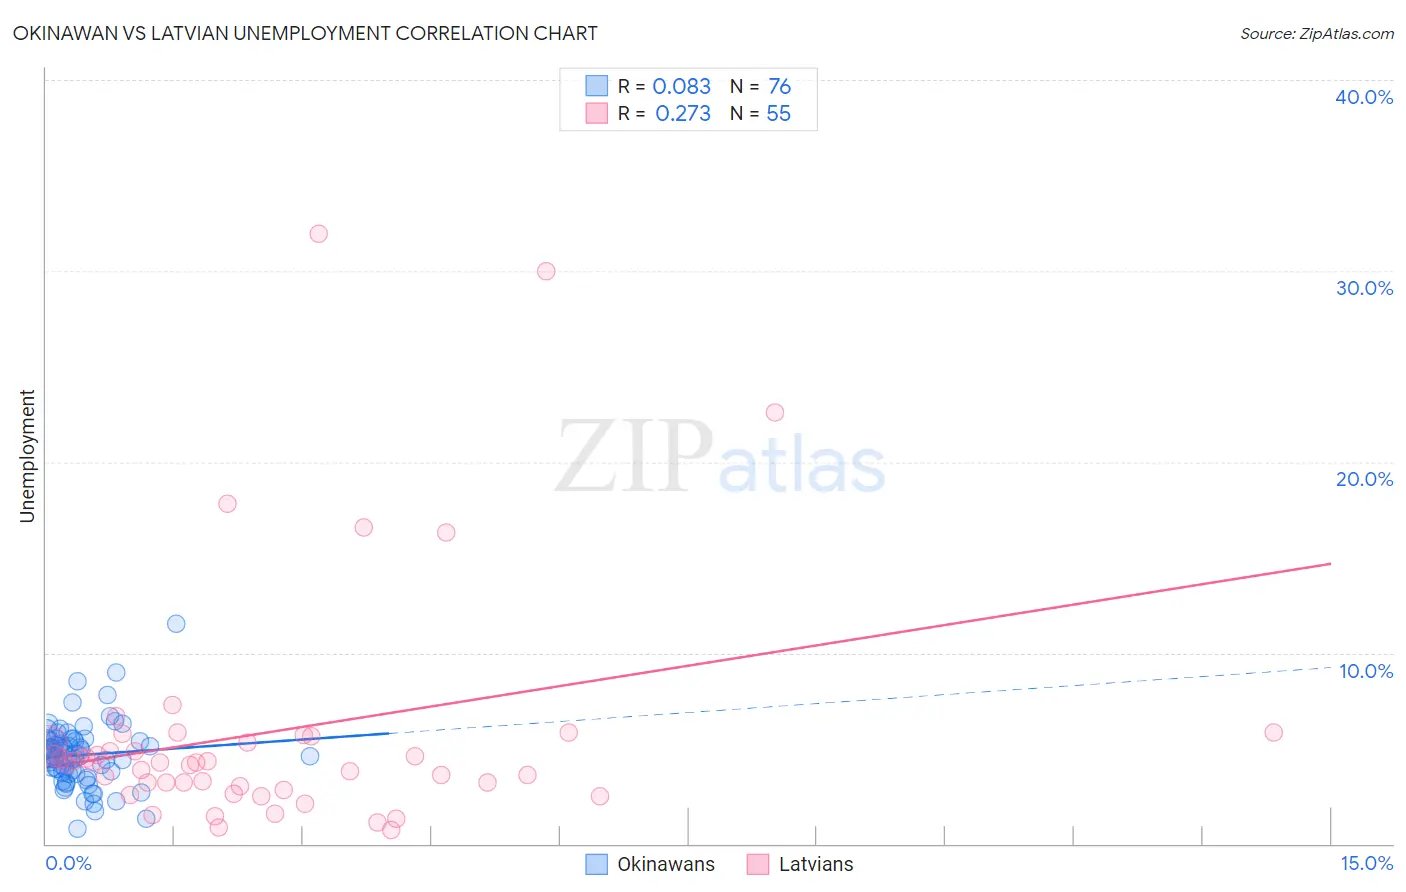
Okinawan vs Latvian Unemployment Correlation Chart
The statistical analysis conducted on geographies consisting of 73,771,070 people shows a slight positive correlation between the proportion of Okinawans and unemployment in the United States with a correlation coefficient (R) of 0.083 and weighted average of 4.9%. Similarly, the statistical analysis conducted on geographies consisting of 220,638,236 people shows a weak positive correlation between the proportion of Latvians and unemployment in the United States with a correlation coefficient (R) of 0.273 and weighted average of 4.7%, a difference of 5.0%.
Unemployment Correlation Summary
| Measurement | Okinawan | Latvian |
| Minimum | 0.80% | 0.70% |
| Maximum | 11.5% | 32.0% |
| Range | 10.7% | 31.3% |
| Mean | 4.6% | 5.9% |
| Median | 4.6% | 4.3% |
| Interquartile 25% (IQ1) | 3.7% | 3.0% |
| Interquartile 75% (IQ3) | 5.5% | 5.6% |
| Interquartile Range (IQR) | 1.8% | 2.6% |
| Standard Deviation (Sample) | 1.7% | 6.4% |
| Standard Deviation (Population) | 1.7% | 6.4% |
Similar Demographics by Unemployment
Demographics Similar to Okinawans by Unemployment
In terms of unemployment, the demographic groups most similar to Okinawans are Cypriot (4.9%, a difference of 0.040%), German Russian (4.9%, a difference of 0.10%), Canadian (5.0%, a difference of 0.12%), Turkish (4.9%, a difference of 0.13%), and Immigrants from Sweden (5.0%, a difference of 0.19%).
| Demographics | Rating | Rank | Unemployment |
| Immigrants | Japan | 98.3 /100 | #71 | Exceptional 4.9% |
| Burmese | 98.3 /100 | #72 | Exceptional 4.9% |
| Paraguayans | 98.3 /100 | #73 | Exceptional 4.9% |
| Immigrants | Northern Europe | 98.2 /100 | #74 | Exceptional 4.9% |
| Turks | 98.0 /100 | #75 | Exceptional 4.9% |
| German Russians | 98.0 /100 | #76 | Exceptional 4.9% |
| Cypriots | 97.9 /100 | #77 | Exceptional 4.9% |
| Okinawans | 97.9 /100 | #78 | Exceptional 4.9% |
| Canadians | 97.7 /100 | #79 | Exceptional 5.0% |
| Immigrants | Sweden | 97.6 /100 | #80 | Exceptional 5.0% |
| Basques | 97.6 /100 | #81 | Exceptional 5.0% |
| Fijians | 97.6 /100 | #82 | Exceptional 5.0% |
| Hmong | 97.6 /100 | #83 | Exceptional 5.0% |
| Russians | 97.4 /100 | #84 | Exceptional 5.0% |
| Immigrants | Australia | 97.0 /100 | #85 | Exceptional 5.0% |
Demographics Similar to Latvians by Unemployment
In terms of unemployment, the demographic groups most similar to Latvians are Bulgarian (4.7%, a difference of 0.040%), Venezuelan (4.7%, a difference of 0.070%), British (4.7%, a difference of 0.15%), Finnish (4.7%, a difference of 0.25%), and Welsh (4.7%, a difference of 0.45%).
| Demographics | Rating | Rank | Unemployment |
| Immigrants | Venezuela | 99.9 /100 | #18 | Exceptional 4.7% |
| Scottish | 99.9 /100 | #19 | Exceptional 4.7% |
| Carpatho Rusyns | 99.9 /100 | #20 | Exceptional 4.7% |
| Welsh | 99.9 /100 | #21 | Exceptional 4.7% |
| Thais | 99.9 /100 | #22 | Exceptional 4.7% |
| British | 99.9 /100 | #23 | Exceptional 4.7% |
| Venezuelans | 99.9 /100 | #24 | Exceptional 4.7% |
| Latvians | 99.9 /100 | #25 | Exceptional 4.7% |
| Bulgarians | 99.9 /100 | #26 | Exceptional 4.7% |
| Finns | 99.9 /100 | #27 | Exceptional 4.7% |
| Cubans | 99.8 /100 | #28 | Exceptional 4.7% |
| Poles | 99.8 /100 | #29 | Exceptional 4.7% |
| Irish | 99.8 /100 | #30 | Exceptional 4.8% |
| Croatians | 99.8 /100 | #31 | Exceptional 4.8% |
| Zimbabweans | 99.8 /100 | #32 | Exceptional 4.8% |