White/Caucasian vs Immigrants from Belarus Unemployment
COMPARE
White/Caucasian
Immigrants from Belarus
Unemployment
Unemployment Comparison
Whites/Caucasians
Immigrants from Belarus
4.9%
UNEMPLOYMENT
99.2/ 100
METRIC RATING
52nd/ 347
METRIC RANK
5.3%
UNEMPLOYMENT
35.6/ 100
METRIC RATING
189th/ 347
METRIC RANK
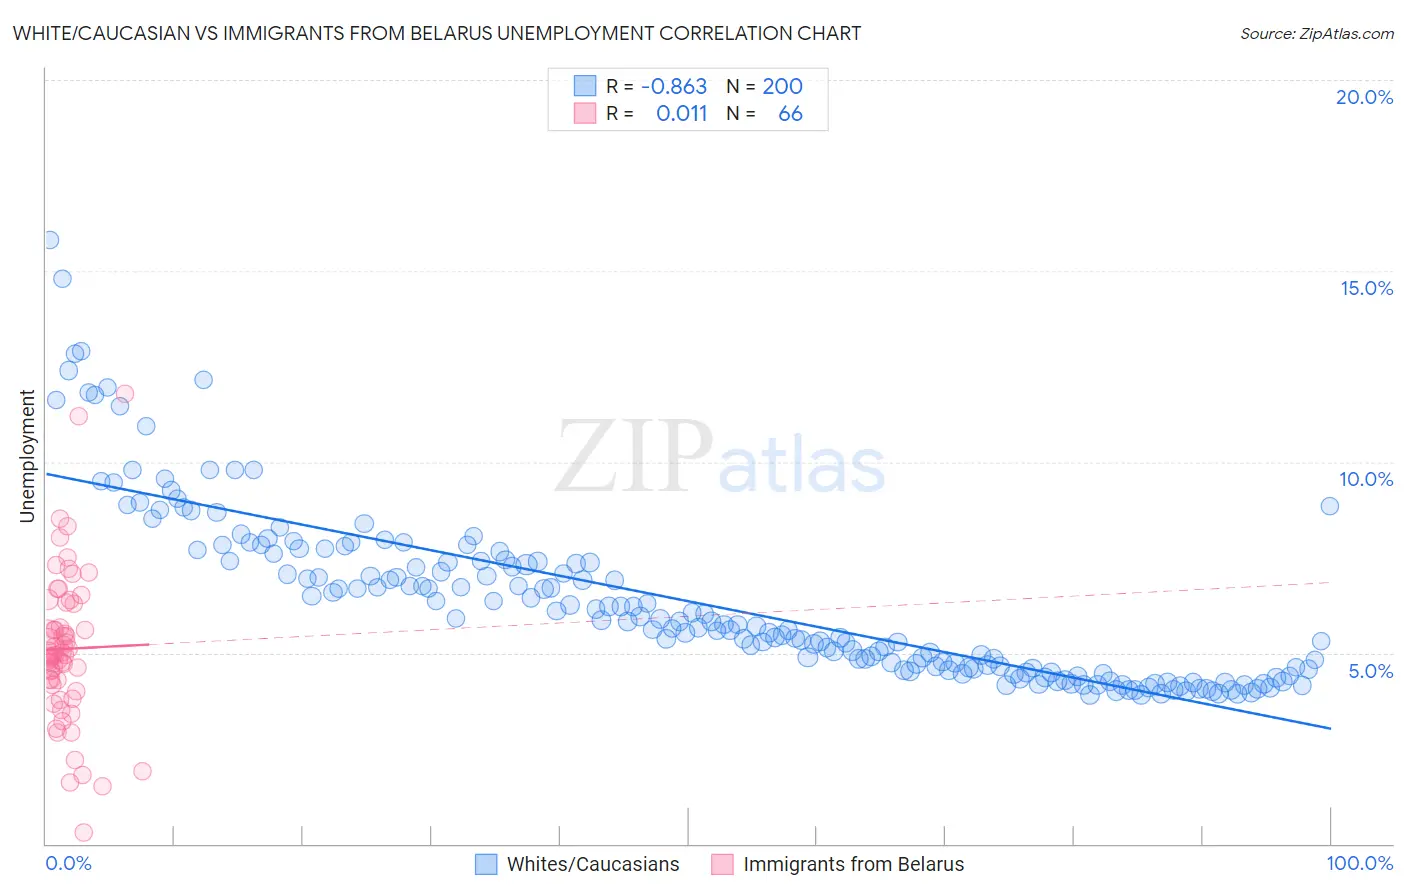
White/Caucasian vs Immigrants from Belarus Unemployment Correlation Chart
The statistical analysis conducted on geographies consisting of 578,869,025 people shows a very strong negative correlation between the proportion of Whites/Caucasians and unemployment in the United States with a correlation coefficient (R) of -0.863 and weighted average of 4.9%. Similarly, the statistical analysis conducted on geographies consisting of 150,154,457 people shows no correlation between the proportion of Immigrants from Belarus and unemployment in the United States with a correlation coefficient (R) of 0.011 and weighted average of 5.3%, a difference of 9.0%.
Unemployment Correlation Summary
| Measurement | White/Caucasian | Immigrants from Belarus |
| Minimum | 3.9% | 0.30% |
| Maximum | 15.8% | 11.8% |
| Range | 11.9% | 11.5% |
| Mean | 6.3% | 5.1% |
| Median | 5.8% | 4.9% |
| Interquartile 25% (IQ1) | 4.6% | 4.2% |
| Interquartile 75% (IQ3) | 7.4% | 6.3% |
| Interquartile Range (IQR) | 2.8% | 2.1% |
| Standard Deviation (Sample) | 2.2% | 2.0% |
| Standard Deviation (Population) | 2.2% | 2.0% |
Similar Demographics by Unemployment
Demographics Similar to Whites/Caucasians by Unemployment
In terms of unemployment, the demographic groups most similar to Whites/Caucasians are Immigrants from Belgium (4.9%, a difference of 0.010%), Immigrants from Zimbabwe (4.9%, a difference of 0.030%), Eastern European (4.9%, a difference of 0.060%), Australian (4.9%, a difference of 0.090%), and French Canadian (4.9%, a difference of 0.17%).
| Demographics | Rating | Rank | Unemployment |
| French | 99.5 /100 | #45 | Exceptional 4.8% |
| Immigrants | Nepal | 99.4 /100 | #46 | Exceptional 4.8% |
| Immigrants | Taiwan | 99.4 /100 | #47 | Exceptional 4.8% |
| Immigrants | Scotland | 99.3 /100 | #48 | Exceptional 4.9% |
| Immigrants | South Central Asia | 99.3 /100 | #49 | Exceptional 4.9% |
| French Canadians | 99.3 /100 | #50 | Exceptional 4.9% |
| Immigrants | Belgium | 99.2 /100 | #51 | Exceptional 4.9% |
| Whites/Caucasians | 99.2 /100 | #52 | Exceptional 4.9% |
| Immigrants | Zimbabwe | 99.2 /100 | #53 | Exceptional 4.9% |
| Eastern Europeans | 99.2 /100 | #54 | Exceptional 4.9% |
| Australians | 99.2 /100 | #55 | Exceptional 4.9% |
| Celtics | 99.1 /100 | #56 | Exceptional 4.9% |
| Immigrants | Singapore | 99.1 /100 | #57 | Exceptional 4.9% |
| Greeks | 99.0 /100 | #58 | Exceptional 4.9% |
| Bhutanese | 99.0 /100 | #59 | Exceptional 4.9% |
Demographics Similar to Immigrants from Belarus by Unemployment
In terms of unemployment, the demographic groups most similar to Immigrants from Belarus are Arab (5.3%, a difference of 0.020%), Alsatian (5.3%, a difference of 0.090%), Somali (5.3%, a difference of 0.11%), South American (5.3%, a difference of 0.11%), and Costa Rican (5.3%, a difference of 0.12%).
| Demographics | Rating | Rank | Unemployment |
| Spaniards | 42.2 /100 | #182 | Average 5.3% |
| Brazilians | 40.2 /100 | #183 | Average 5.3% |
| Assyrians/Chaldeans/Syriacs | 39.2 /100 | #184 | Fair 5.3% |
| Immigrants | Thailand | 38.9 /100 | #185 | Fair 5.3% |
| Immigrants | Uganda | 37.8 /100 | #186 | Fair 5.3% |
| Costa Ricans | 37.4 /100 | #187 | Fair 5.3% |
| Alsatians | 37.0 /100 | #188 | Fair 5.3% |
| Immigrants | Belarus | 35.6 /100 | #189 | Fair 5.3% |
| Arabs | 35.3 /100 | #190 | Fair 5.3% |
| Somalis | 34.0 /100 | #191 | Fair 5.3% |
| South Americans | 33.9 /100 | #192 | Fair 5.3% |
| Immigrants | Somalia | 33.8 /100 | #193 | Fair 5.3% |
| Immigrants | Laos | 30.9 /100 | #194 | Fair 5.3% |
| Immigrants | Southern Europe | 30.9 /100 | #195 | Fair 5.3% |
| Peruvians | 29.9 /100 | #196 | Fair 5.3% |