Immigrants from Congo vs Argentinean Unemployment
COMPARE
Immigrants from Congo
Argentinean
Unemployment
Unemployment Comparison
Immigrants from Congo
Argentineans
5.3%
UNEMPLOYMENT
50.0/ 100
METRIC RATING
174th/ 347
METRIC RANK
5.1%
UNEMPLOYMENT
92.4/ 100
METRIC RATING
113th/ 347
METRIC RANK
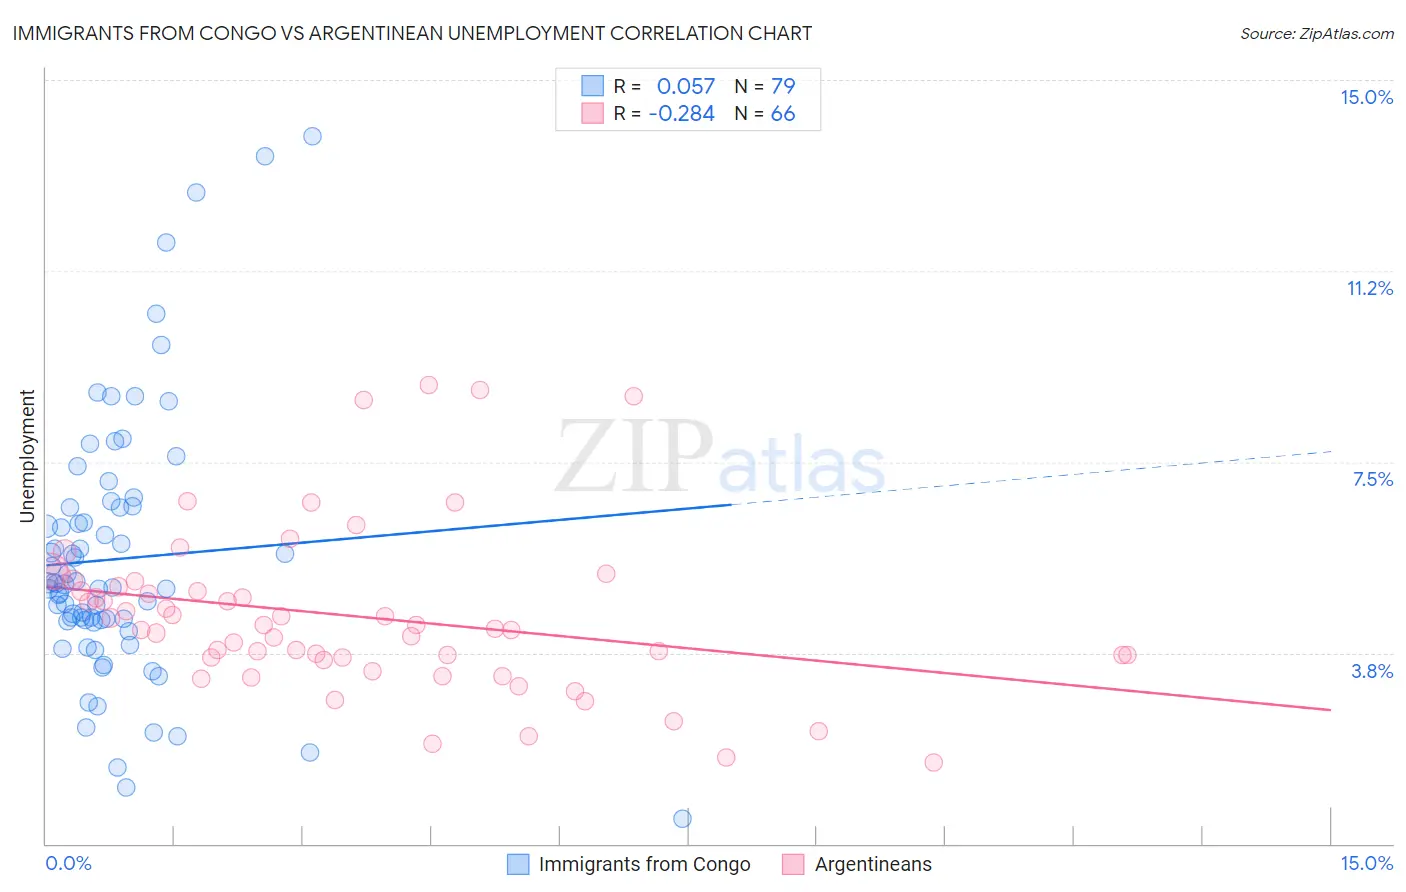
Immigrants from Congo vs Argentinean Unemployment Correlation Chart
The statistical analysis conducted on geographies consisting of 92,111,963 people shows a slight positive correlation between the proportion of Immigrants from Congo and unemployment in the United States with a correlation coefficient (R) of 0.057 and weighted average of 5.3%. Similarly, the statistical analysis conducted on geographies consisting of 297,046,481 people shows a weak negative correlation between the proportion of Argentineans and unemployment in the United States with a correlation coefficient (R) of -0.284 and weighted average of 5.1%, a difference of 4.0%.
Unemployment Correlation Summary
| Measurement | Immigrants from Congo | Argentinean |
| Minimum | 0.50% | 1.6% |
| Maximum | 13.9% | 9.0% |
| Range | 13.4% | 7.4% |
| Mean | 5.6% | 4.5% |
| Median | 5.1% | 4.3% |
| Interquartile 25% (IQ1) | 4.4% | 3.7% |
| Interquartile 75% (IQ3) | 6.6% | 5.0% |
| Interquartile Range (IQR) | 2.2% | 1.4% |
| Standard Deviation (Sample) | 2.6% | 1.6% |
| Standard Deviation (Population) | 2.6% | 1.6% |
Similar Demographics by Unemployment
Demographics Similar to Immigrants from Congo by Unemployment
In terms of unemployment, the demographic groups most similar to Immigrants from Congo are Taiwanese (5.3%, a difference of 0.020%), Nicaraguan (5.3%, a difference of 0.080%), Immigrants from Poland (5.3%, a difference of 0.11%), Nonimmigrants (5.3%, a difference of 0.13%), and Immigrants from Vietnam (5.2%, a difference of 0.15%).
| Demographics | Rating | Rank | Unemployment |
| Colombians | 61.1 /100 | #167 | Good 5.2% |
| Uruguayans | 60.2 /100 | #168 | Good 5.2% |
| Immigrants | Morocco | 59.1 /100 | #169 | Average 5.2% |
| Immigrants | Nicaragua | 57.1 /100 | #170 | Average 5.2% |
| Puget Sound Salish | 56.6 /100 | #171 | Average 5.2% |
| Immigrants | Vietnam | 52.5 /100 | #172 | Average 5.2% |
| Immigrants | Poland | 51.8 /100 | #173 | Average 5.3% |
| Immigrants | Congo | 50.0 /100 | #174 | Average 5.3% |
| Taiwanese | 49.6 /100 | #175 | Average 5.3% |
| Nicaraguans | 48.7 /100 | #176 | Average 5.3% |
| Immigrants | Nonimmigrants | 47.9 /100 | #177 | Average 5.3% |
| Afghans | 47.4 /100 | #178 | Average 5.3% |
| Malaysians | 46.8 /100 | #179 | Average 5.3% |
| Immigrants | Greece | 45.0 /100 | #180 | Average 5.3% |
| Albanians | 43.5 /100 | #181 | Average 5.3% |
Demographics Similar to Argentineans by Unemployment
In terms of unemployment, the demographic groups most similar to Argentineans are South African (5.1%, a difference of 0.040%), Immigrants from Ireland (5.1%, a difference of 0.060%), Immigrants from Lithuania (5.0%, a difference of 0.19%), Chilean (5.0%, a difference of 0.19%), and Immigrants from Eritrea (5.0%, a difference of 0.21%).
| Demographics | Rating | Rank | Unemployment |
| Immigrants | Romania | 93.7 /100 | #106 | Exceptional 5.0% |
| Immigrants | Turkey | 93.7 /100 | #107 | Exceptional 5.0% |
| Immigrants | Kuwait | 93.7 /100 | #108 | Exceptional 5.0% |
| Immigrants | Eritrea | 93.3 /100 | #109 | Exceptional 5.0% |
| Immigrants | Lithuania | 93.2 /100 | #110 | Exceptional 5.0% |
| Chileans | 93.2 /100 | #111 | Exceptional 5.0% |
| South Africans | 92.6 /100 | #112 | Exceptional 5.1% |
| Argentineans | 92.4 /100 | #113 | Exceptional 5.1% |
| Immigrants | Ireland | 92.1 /100 | #114 | Exceptional 5.1% |
| Immigrants | Western Europe | 91.1 /100 | #115 | Exceptional 5.1% |
| Immigrants | Sri Lanka | 91.1 /100 | #116 | Exceptional 5.1% |
| Immigrants | Malaysia | 91.0 /100 | #117 | Exceptional 5.1% |
| Immigrants | Germany | 90.8 /100 | #118 | Exceptional 5.1% |
| Immigrants | France | 89.7 /100 | #119 | Excellent 5.1% |
| Macedonians | 89.7 /100 | #120 | Excellent 5.1% |