Guamanian/Chamorro vs Argentinean Unemployment
COMPARE
Guamanian/Chamorro
Argentinean
Unemployment
Unemployment Comparison
Guamanians/Chamorros
Argentineans
5.5%
UNEMPLOYMENT
6.3/ 100
METRIC RATING
228th/ 347
METRIC RANK
5.1%
UNEMPLOYMENT
92.4/ 100
METRIC RATING
113th/ 347
METRIC RANK
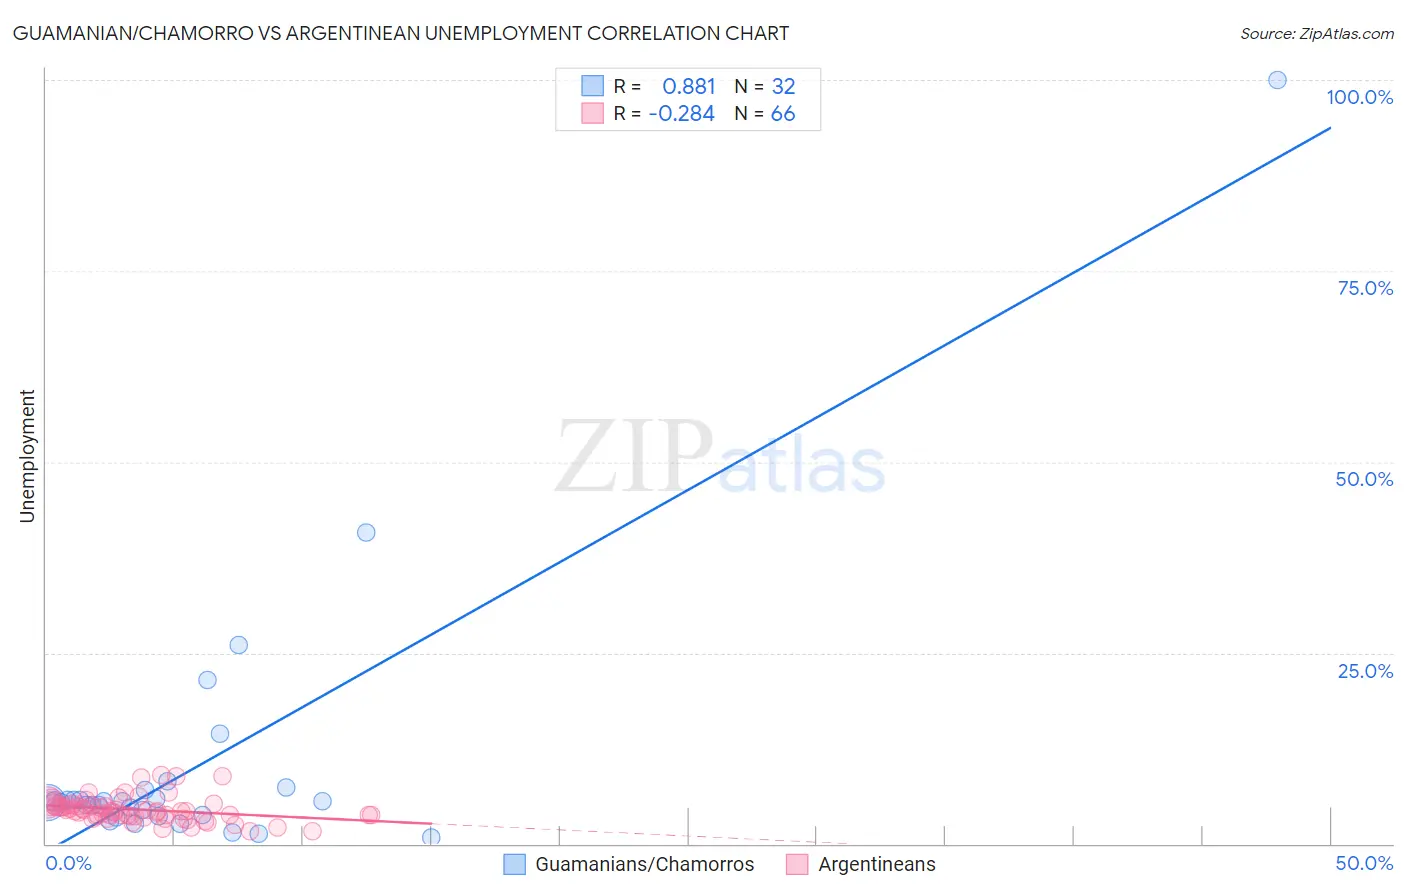
Guamanian/Chamorro vs Argentinean Unemployment Correlation Chart
The statistical analysis conducted on geographies consisting of 221,788,183 people shows a very strong positive correlation between the proportion of Guamanians/Chamorros and unemployment in the United States with a correlation coefficient (R) of 0.881 and weighted average of 5.5%. Similarly, the statistical analysis conducted on geographies consisting of 297,046,481 people shows a weak negative correlation between the proportion of Argentineans and unemployment in the United States with a correlation coefficient (R) of -0.284 and weighted average of 5.1%, a difference of 8.3%.
Unemployment Correlation Summary
| Measurement | Guamanian/Chamorro | Argentinean |
| Minimum | 0.80% | 1.6% |
| Maximum | 100.0% | 9.0% |
| Range | 99.2% | 7.4% |
| Mean | 10.3% | 4.5% |
| Median | 5.5% | 4.3% |
| Interquartile 25% (IQ1) | 3.6% | 3.7% |
| Interquartile 75% (IQ3) | 6.5% | 5.0% |
| Interquartile Range (IQR) | 2.8% | 1.4% |
| Standard Deviation (Sample) | 18.2% | 1.6% |
| Standard Deviation (Population) | 17.9% | 1.6% |
Similar Demographics by Unemployment
Demographics Similar to Guamanians/Chamorros by Unemployment
In terms of unemployment, the demographic groups most similar to Guamanians/Chamorros are Immigrants from Lebanon (5.5%, a difference of 0.15%), Samoan (5.5%, a difference of 0.18%), Hawaiian (5.5%, a difference of 0.26%), Ottawa (5.5%, a difference of 0.26%), and South American Indian (5.5%, a difference of 0.33%).
| Demographics | Rating | Rank | Unemployment |
| Immigrants | Philippines | 10.4 /100 | #221 | Poor 5.4% |
| Iroquois | 10.3 /100 | #222 | Poor 5.4% |
| Seminole | 9.2 /100 | #223 | Tragic 5.4% |
| Israelis | 8.8 /100 | #224 | Tragic 5.4% |
| South American Indians | 7.8 /100 | #225 | Tragic 5.5% |
| Samoans | 7.1 /100 | #226 | Tragic 5.5% |
| Immigrants | Lebanon | 7.0 /100 | #227 | Tragic 5.5% |
| Guamanians/Chamorros | 6.3 /100 | #228 | Tragic 5.5% |
| Hawaiians | 5.4 /100 | #229 | Tragic 5.5% |
| Ottawa | 5.4 /100 | #230 | Tragic 5.5% |
| Immigrants | Africa | 4.9 /100 | #231 | Tragic 5.5% |
| Comanche | 4.9 /100 | #232 | Tragic 5.5% |
| Immigrants | Syria | 4.8 /100 | #233 | Tragic 5.5% |
| Panamanians | 4.7 /100 | #234 | Tragic 5.5% |
| Immigrants | Panama | 3.4 /100 | #235 | Tragic 5.5% |
Demographics Similar to Argentineans by Unemployment
In terms of unemployment, the demographic groups most similar to Argentineans are South African (5.1%, a difference of 0.040%), Immigrants from Ireland (5.1%, a difference of 0.060%), Immigrants from Lithuania (5.0%, a difference of 0.19%), Chilean (5.0%, a difference of 0.19%), and Immigrants from Eritrea (5.0%, a difference of 0.21%).
| Demographics | Rating | Rank | Unemployment |
| Immigrants | Romania | 93.7 /100 | #106 | Exceptional 5.0% |
| Immigrants | Turkey | 93.7 /100 | #107 | Exceptional 5.0% |
| Immigrants | Kuwait | 93.7 /100 | #108 | Exceptional 5.0% |
| Immigrants | Eritrea | 93.3 /100 | #109 | Exceptional 5.0% |
| Immigrants | Lithuania | 93.2 /100 | #110 | Exceptional 5.0% |
| Chileans | 93.2 /100 | #111 | Exceptional 5.0% |
| South Africans | 92.6 /100 | #112 | Exceptional 5.1% |
| Argentineans | 92.4 /100 | #113 | Exceptional 5.1% |
| Immigrants | Ireland | 92.1 /100 | #114 | Exceptional 5.1% |
| Immigrants | Western Europe | 91.1 /100 | #115 | Exceptional 5.1% |
| Immigrants | Sri Lanka | 91.1 /100 | #116 | Exceptional 5.1% |
| Immigrants | Malaysia | 91.0 /100 | #117 | Exceptional 5.1% |
| Immigrants | Germany | 90.8 /100 | #118 | Exceptional 5.1% |
| Immigrants | France | 89.7 /100 | #119 | Excellent 5.1% |
| Macedonians | 89.7 /100 | #120 | Excellent 5.1% |