West Indian vs Immigrants from Uganda Unemployment
COMPARE
West Indian
Immigrants from Uganda
Unemployment
Unemployment Comparison
West Indians
Immigrants from Uganda
6.4%
UNEMPLOYMENT
0.0/ 100
METRIC RATING
302nd/ 347
METRIC RANK
5.3%
UNEMPLOYMENT
37.8/ 100
METRIC RATING
186th/ 347
METRIC RANK
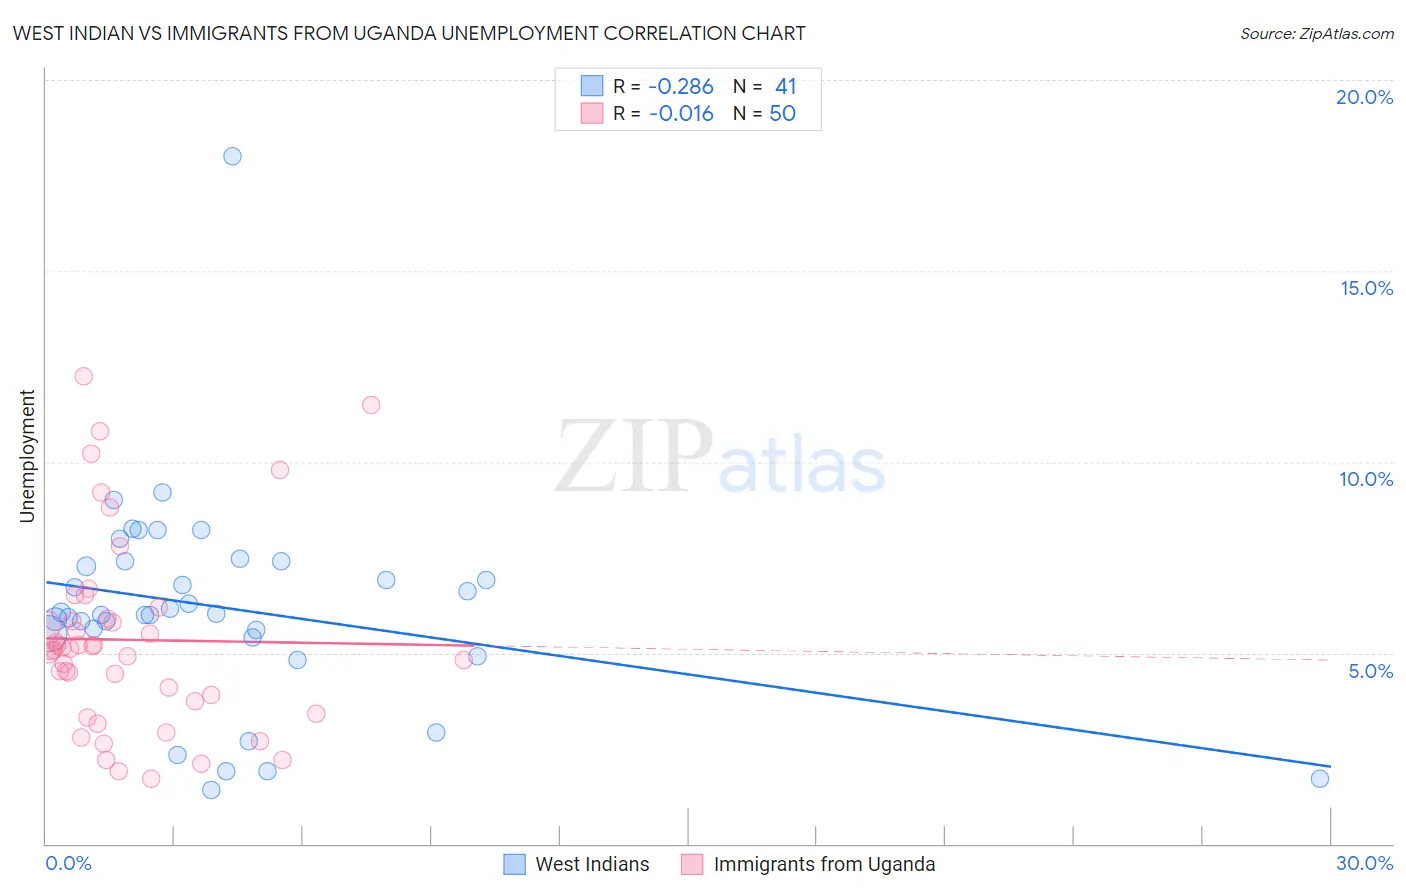
West Indian vs Immigrants from Uganda Unemployment Correlation Chart
The statistical analysis conducted on geographies consisting of 253,931,016 people shows a weak negative correlation between the proportion of West Indians and unemployment in the United States with a correlation coefficient (R) of -0.286 and weighted average of 6.4%. Similarly, the statistical analysis conducted on geographies consisting of 125,961,312 people shows no correlation between the proportion of Immigrants from Uganda and unemployment in the United States with a correlation coefficient (R) of -0.016 and weighted average of 5.3%, a difference of 20.1%.
Unemployment Correlation Summary
| Measurement | West Indian | Immigrants from Uganda |
| Minimum | 1.4% | 1.7% |
| Maximum | 18.0% | 12.2% |
| Range | 16.6% | 10.5% |
| Mean | 6.2% | 5.3% |
| Median | 6.0% | 5.1% |
| Interquartile 25% (IQ1) | 5.5% | 3.7% |
| Interquartile 75% (IQ3) | 7.4% | 5.9% |
| Interquartile Range (IQR) | 1.9% | 2.2% |
| Standard Deviation (Sample) | 2.8% | 2.5% |
| Standard Deviation (Population) | 2.7% | 2.5% |
Similar Demographics by Unemployment
Demographics Similar to West Indians by Unemployment
In terms of unemployment, the demographic groups most similar to West Indians are Belizean (6.4%, a difference of 0.23%), Trinidadian and Tobagonian (6.3%, a difference of 0.25%), Immigrants from Trinidad and Tobago (6.3%, a difference of 0.74%), Immigrants from West Indies (6.3%, a difference of 0.86%), and Immigrants from Haiti (6.3%, a difference of 0.90%).
| Demographics | Rating | Rank | Unemployment |
| U.S. Virgin Islanders | 0.0 /100 | #295 | Tragic 6.3% |
| Ute | 0.0 /100 | #296 | Tragic 6.3% |
| Jamaicans | 0.0 /100 | #297 | Tragic 6.3% |
| Immigrants | Haiti | 0.0 /100 | #298 | Tragic 6.3% |
| Immigrants | West Indies | 0.0 /100 | #299 | Tragic 6.3% |
| Immigrants | Trinidad and Tobago | 0.0 /100 | #300 | Tragic 6.3% |
| Trinidadians and Tobagonians | 0.0 /100 | #301 | Tragic 6.3% |
| West Indians | 0.0 /100 | #302 | Tragic 6.4% |
| Belizeans | 0.0 /100 | #303 | Tragic 6.4% |
| Immigrants | Jamaica | 0.0 /100 | #304 | Tragic 6.4% |
| Menominee | 0.0 /100 | #305 | Tragic 6.4% |
| Lumbee | 0.0 /100 | #306 | Tragic 6.4% |
| Immigrants | Bangladesh | 0.0 /100 | #307 | Tragic 6.5% |
| Barbadians | 0.0 /100 | #308 | Tragic 6.5% |
| Vietnamese | 0.0 /100 | #309 | Tragic 6.5% |
Demographics Similar to Immigrants from Uganda by Unemployment
In terms of unemployment, the demographic groups most similar to Immigrants from Uganda are Costa Rican (5.3%, a difference of 0.030%), Alsatian (5.3%, a difference of 0.050%), Immigrants from Thailand (5.3%, a difference of 0.070%), Assyrian/Chaldean/Syriac (5.3%, a difference of 0.090%), and Brazilian (5.3%, a difference of 0.15%).
| Demographics | Rating | Rank | Unemployment |
| Malaysians | 46.8 /100 | #179 | Average 5.3% |
| Immigrants | Greece | 45.0 /100 | #180 | Average 5.3% |
| Albanians | 43.5 /100 | #181 | Average 5.3% |
| Spaniards | 42.2 /100 | #182 | Average 5.3% |
| Brazilians | 40.2 /100 | #183 | Average 5.3% |
| Assyrians/Chaldeans/Syriacs | 39.2 /100 | #184 | Fair 5.3% |
| Immigrants | Thailand | 38.9 /100 | #185 | Fair 5.3% |
| Immigrants | Uganda | 37.8 /100 | #186 | Fair 5.3% |
| Costa Ricans | 37.4 /100 | #187 | Fair 5.3% |
| Alsatians | 37.0 /100 | #188 | Fair 5.3% |
| Immigrants | Belarus | 35.6 /100 | #189 | Fair 5.3% |
| Arabs | 35.3 /100 | #190 | Fair 5.3% |
| Somalis | 34.0 /100 | #191 | Fair 5.3% |
| South Americans | 33.9 /100 | #192 | Fair 5.3% |
| Immigrants | Somalia | 33.8 /100 | #193 | Fair 5.3% |