West Indian vs Immigrants from Uganda Median Female Earnings
COMPARE
West Indian
Immigrants from Uganda
Median Female Earnings
Median Female Earnings Comparison
West Indians
Immigrants from Uganda
$40,317
MEDIAN FEMALE EARNINGS
78.4/ 100
METRIC RATING
152nd/ 347
METRIC RANK
$40,739
MEDIAN FEMALE EARNINGS
89.7/ 100
METRIC RATING
132nd/ 347
METRIC RANK
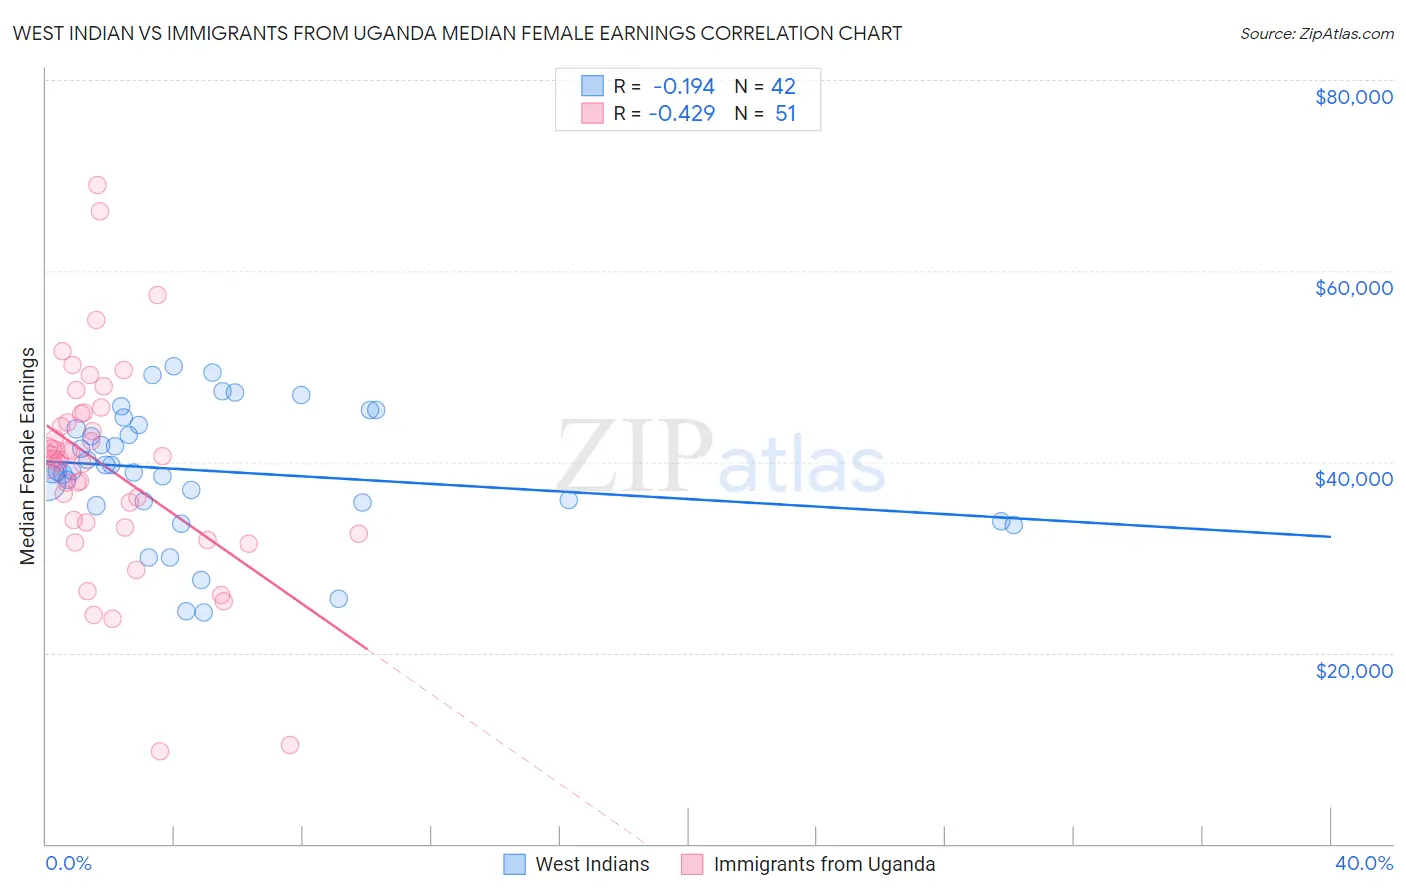
West Indian vs Immigrants from Uganda Median Female Earnings Correlation Chart
The statistical analysis conducted on geographies consisting of 253,995,323 people shows a poor negative correlation between the proportion of West Indians and median female earnings in the United States with a correlation coefficient (R) of -0.194 and weighted average of $40,317. Similarly, the statistical analysis conducted on geographies consisting of 125,969,564 people shows a moderate negative correlation between the proportion of Immigrants from Uganda and median female earnings in the United States with a correlation coefficient (R) of -0.429 and weighted average of $40,739, a difference of 1.1%.
Median Female Earnings Correlation Summary
| Measurement | West Indian | Immigrants from Uganda |
| Minimum | $24,276 | $9,732 |
| Maximum | $50,049 | $69,004 |
| Range | $25,773 | $59,272 |
| Mean | $39,058 | $39,368 |
| Median | $39,050 | $40,305 |
| Interquartile 25% (IQ1) | $35,688 | $33,173 |
| Interquartile 75% (IQ3) | $43,912 | $44,985 |
| Interquartile Range (IQR) | $8,224 | $11,812 |
| Standard Deviation (Sample) | $6,683 | $11,139 |
| Standard Deviation (Population) | $6,603 | $11,029 |
Demographics Similar to West Indians and Immigrants from Uganda by Median Female Earnings
In terms of median female earnings, the demographic groups most similar to West Indians are Immigrants from Armenia ($40,340, a difference of 0.060%), Immigrants from Cameroon ($40,354, a difference of 0.090%), Immigrants from Chile ($40,353, a difference of 0.090%), Polish ($40,371, a difference of 0.13%), and Vietnamese ($40,377, a difference of 0.15%). Similarly, the demographic groups most similar to Immigrants from Uganda are Syrian ($40,727, a difference of 0.030%), Arab ($40,718, a difference of 0.050%), Immigrants from Nepal ($40,704, a difference of 0.090%), Immigrants from Eastern Africa ($40,644, a difference of 0.23%), and Pakistani ($40,596, a difference of 0.35%).
| Demographics | Rating | Rank | Median Female Earnings |
| Immigrants | Uganda | 89.7 /100 | #132 | Excellent $40,739 |
| Syrians | 89.5 /100 | #133 | Excellent $40,727 |
| Arabs | 89.3 /100 | #134 | Excellent $40,718 |
| Immigrants | Nepal | 89.0 /100 | #135 | Excellent $40,704 |
| Immigrants | Eastern Africa | 87.7 /100 | #136 | Excellent $40,644 |
| Pakistanis | 86.6 /100 | #137 | Excellent $40,596 |
| Taiwanese | 86.1 /100 | #138 | Excellent $40,576 |
| Immigrants | South Eastern Asia | 85.7 /100 | #139 | Excellent $40,558 |
| Serbians | 85.2 /100 | #140 | Excellent $40,539 |
| Immigrants | Syria | 84.1 /100 | #141 | Excellent $40,499 |
| Sri Lankans | 84.0 /100 | #142 | Excellent $40,496 |
| Northern Europeans | 83.9 /100 | #143 | Excellent $40,491 |
| Immigrants | North Macedonia | 83.8 /100 | #144 | Excellent $40,488 |
| Brazilians | 83.6 /100 | #145 | Excellent $40,483 |
| Ghanaians | 82.1 /100 | #146 | Excellent $40,429 |
| Vietnamese | 80.4 /100 | #147 | Excellent $40,377 |
| Poles | 80.2 /100 | #148 | Excellent $40,371 |
| Immigrants | Cameroon | 79.7 /100 | #149 | Good $40,354 |
| Immigrants | Chile | 79.6 /100 | #150 | Good $40,353 |
| Immigrants | Armenia | 79.2 /100 | #151 | Good $40,340 |
| West Indians | 78.4 /100 | #152 | Good $40,317 |