Serbian vs Immigrants from Uganda Unemployment
COMPARE
Serbian
Immigrants from Uganda
Unemployment
Unemployment Comparison
Serbians
Immigrants from Uganda
4.9%
UNEMPLOYMENT
98.4/ 100
METRIC RATING
70th/ 347
METRIC RANK
5.3%
UNEMPLOYMENT
37.8/ 100
METRIC RATING
186th/ 347
METRIC RANK
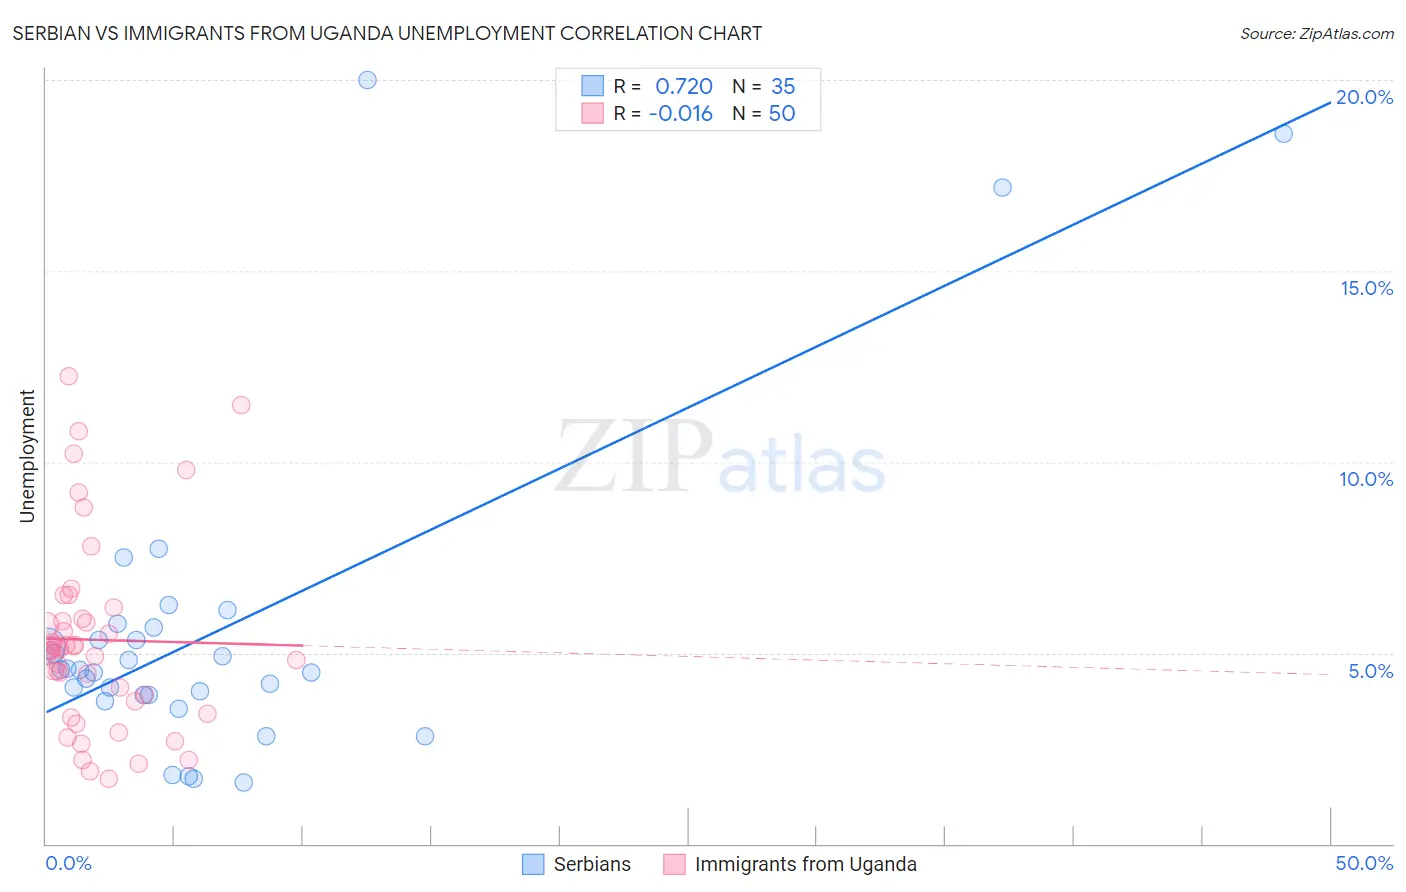
Serbian vs Immigrants from Uganda Unemployment Correlation Chart
The statistical analysis conducted on geographies consisting of 267,457,297 people shows a strong positive correlation between the proportion of Serbians and unemployment in the United States with a correlation coefficient (R) of 0.720 and weighted average of 4.9%. Similarly, the statistical analysis conducted on geographies consisting of 125,961,312 people shows no correlation between the proportion of Immigrants from Uganda and unemployment in the United States with a correlation coefficient (R) of -0.016 and weighted average of 5.3%, a difference of 7.6%.
Unemployment Correlation Summary
| Measurement | Serbian | Immigrants from Uganda |
| Minimum | 1.6% | 1.7% |
| Maximum | 20.0% | 12.2% |
| Range | 18.4% | 10.5% |
| Mean | 5.6% | 5.3% |
| Median | 4.6% | 5.1% |
| Interquartile 25% (IQ1) | 3.9% | 3.7% |
| Interquartile 75% (IQ3) | 5.7% | 5.9% |
| Interquartile Range (IQR) | 1.8% | 2.2% |
| Standard Deviation (Sample) | 4.3% | 2.5% |
| Standard Deviation (Population) | 4.2% | 2.5% |
Similar Demographics by Unemployment
Demographics Similar to Serbians by Unemployment
In terms of unemployment, the demographic groups most similar to Serbians are Immigrants from Japan (4.9%, a difference of 0.050%), Burmese (4.9%, a difference of 0.080%), Paraguayan (4.9%, a difference of 0.12%), Immigrants from North America (4.9%, a difference of 0.15%), and Immigrants from Northern Europe (4.9%, a difference of 0.21%).
| Demographics | Rating | Rank | Unemployment |
| Immigrants | Bulgaria | 98.9 /100 | #63 | Exceptional 4.9% |
| Italians | 98.9 /100 | #64 | Exceptional 4.9% |
| Immigrants | Canada | 98.8 /100 | #65 | Exceptional 4.9% |
| Slovaks | 98.7 /100 | #66 | Exceptional 4.9% |
| New Zealanders | 98.6 /100 | #67 | Exceptional 4.9% |
| Slavs | 98.6 /100 | #68 | Exceptional 4.9% |
| Immigrants | North America | 98.5 /100 | #69 | Exceptional 4.9% |
| Serbians | 98.4 /100 | #70 | Exceptional 4.9% |
| Immigrants | Japan | 98.3 /100 | #71 | Exceptional 4.9% |
| Burmese | 98.3 /100 | #72 | Exceptional 4.9% |
| Paraguayans | 98.3 /100 | #73 | Exceptional 4.9% |
| Immigrants | Northern Europe | 98.2 /100 | #74 | Exceptional 4.9% |
| Turks | 98.0 /100 | #75 | Exceptional 4.9% |
| German Russians | 98.0 /100 | #76 | Exceptional 4.9% |
| Cypriots | 97.9 /100 | #77 | Exceptional 4.9% |
Demographics Similar to Immigrants from Uganda by Unemployment
In terms of unemployment, the demographic groups most similar to Immigrants from Uganda are Costa Rican (5.3%, a difference of 0.030%), Alsatian (5.3%, a difference of 0.050%), Immigrants from Thailand (5.3%, a difference of 0.070%), Assyrian/Chaldean/Syriac (5.3%, a difference of 0.090%), and Brazilian (5.3%, a difference of 0.15%).
| Demographics | Rating | Rank | Unemployment |
| Malaysians | 46.8 /100 | #179 | Average 5.3% |
| Immigrants | Greece | 45.0 /100 | #180 | Average 5.3% |
| Albanians | 43.5 /100 | #181 | Average 5.3% |
| Spaniards | 42.2 /100 | #182 | Average 5.3% |
| Brazilians | 40.2 /100 | #183 | Average 5.3% |
| Assyrians/Chaldeans/Syriacs | 39.2 /100 | #184 | Fair 5.3% |
| Immigrants | Thailand | 38.9 /100 | #185 | Fair 5.3% |
| Immigrants | Uganda | 37.8 /100 | #186 | Fair 5.3% |
| Costa Ricans | 37.4 /100 | #187 | Fair 5.3% |
| Alsatians | 37.0 /100 | #188 | Fair 5.3% |
| Immigrants | Belarus | 35.6 /100 | #189 | Fair 5.3% |
| Arabs | 35.3 /100 | #190 | Fair 5.3% |
| Somalis | 34.0 /100 | #191 | Fair 5.3% |
| South Americans | 33.9 /100 | #192 | Fair 5.3% |
| Immigrants | Somalia | 33.8 /100 | #193 | Fair 5.3% |