West Indian vs Immigrants from Austria Unemployment
COMPARE
West Indian
Immigrants from Austria
Unemployment
Unemployment Comparison
West Indians
Immigrants from Austria
6.4%
UNEMPLOYMENT
0.0/ 100
METRIC RATING
302nd/ 347
METRIC RANK
5.0%
UNEMPLOYMENT
95.9/ 100
METRIC RATING
94th/ 347
METRIC RANK
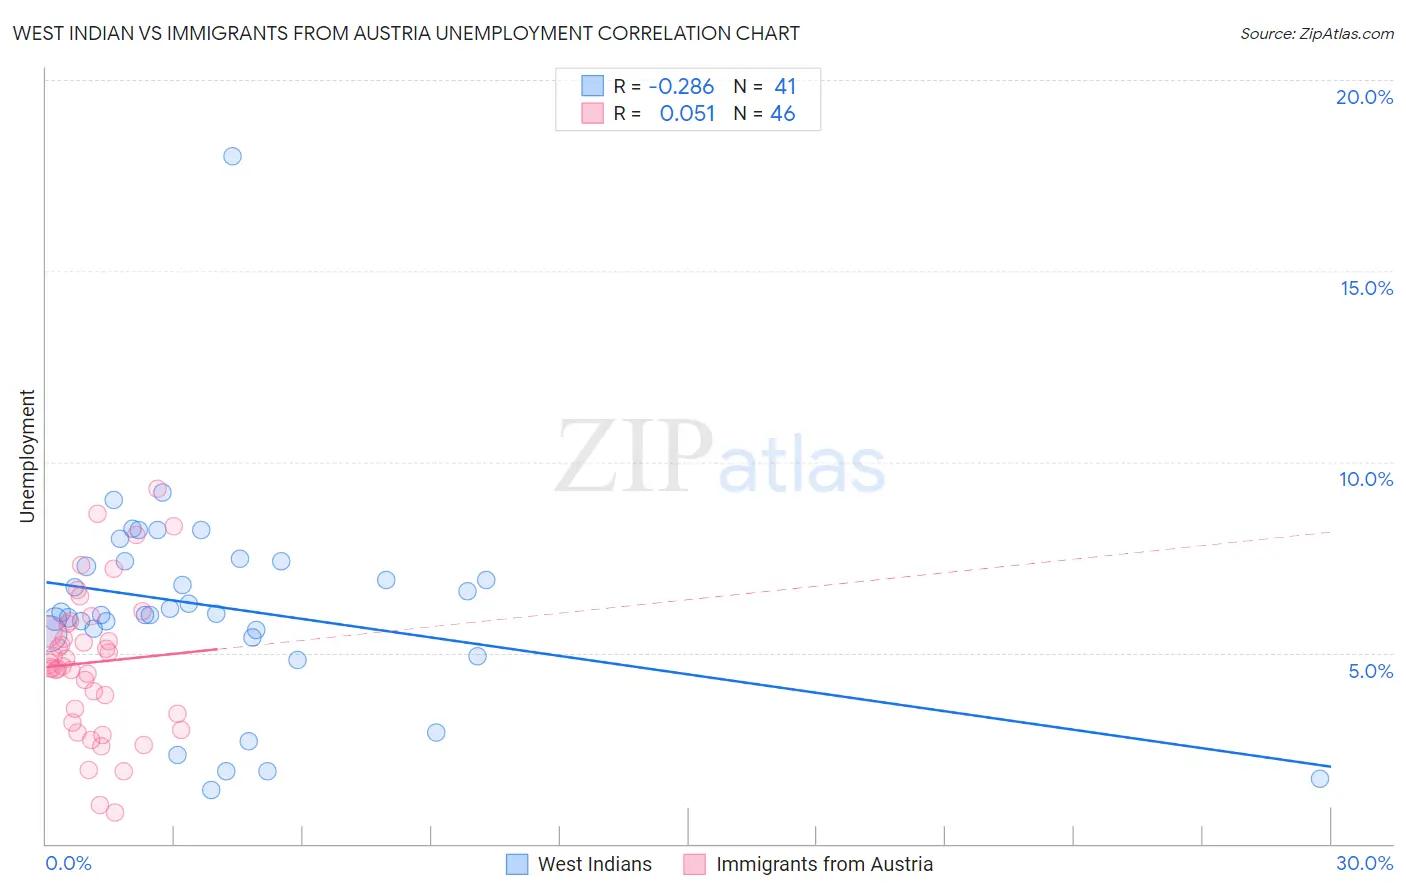
West Indian vs Immigrants from Austria Unemployment Correlation Chart
The statistical analysis conducted on geographies consisting of 253,931,016 people shows a weak negative correlation between the proportion of West Indians and unemployment in the United States with a correlation coefficient (R) of -0.286 and weighted average of 6.4%. Similarly, the statistical analysis conducted on geographies consisting of 167,916,125 people shows a slight positive correlation between the proportion of Immigrants from Austria and unemployment in the United States with a correlation coefficient (R) of 0.051 and weighted average of 5.0%, a difference of 27.2%.
Unemployment Correlation Summary
| Measurement | West Indian | Immigrants from Austria |
| Minimum | 1.4% | 0.82% |
| Maximum | 18.0% | 9.3% |
| Range | 16.6% | 8.5% |
| Mean | 6.2% | 4.8% |
| Median | 6.0% | 4.7% |
| Interquartile 25% (IQ1) | 5.5% | 3.4% |
| Interquartile 75% (IQ3) | 7.4% | 5.8% |
| Interquartile Range (IQR) | 1.9% | 2.4% |
| Standard Deviation (Sample) | 2.8% | 1.9% |
| Standard Deviation (Population) | 2.7% | 1.9% |
Similar Demographics by Unemployment
Demographics Similar to West Indians by Unemployment
In terms of unemployment, the demographic groups most similar to West Indians are Belizean (6.4%, a difference of 0.23%), Trinidadian and Tobagonian (6.3%, a difference of 0.25%), Immigrants from Trinidad and Tobago (6.3%, a difference of 0.74%), Immigrants from West Indies (6.3%, a difference of 0.86%), and Immigrants from Haiti (6.3%, a difference of 0.90%).
| Demographics | Rating | Rank | Unemployment |
| U.S. Virgin Islanders | 0.0 /100 | #295 | Tragic 6.3% |
| Ute | 0.0 /100 | #296 | Tragic 6.3% |
| Jamaicans | 0.0 /100 | #297 | Tragic 6.3% |
| Immigrants | Haiti | 0.0 /100 | #298 | Tragic 6.3% |
| Immigrants | West Indies | 0.0 /100 | #299 | Tragic 6.3% |
| Immigrants | Trinidad and Tobago | 0.0 /100 | #300 | Tragic 6.3% |
| Trinidadians and Tobagonians | 0.0 /100 | #301 | Tragic 6.3% |
| West Indians | 0.0 /100 | #302 | Tragic 6.4% |
| Belizeans | 0.0 /100 | #303 | Tragic 6.4% |
| Immigrants | Jamaica | 0.0 /100 | #304 | Tragic 6.4% |
| Menominee | 0.0 /100 | #305 | Tragic 6.4% |
| Lumbee | 0.0 /100 | #306 | Tragic 6.4% |
| Immigrants | Bangladesh | 0.0 /100 | #307 | Tragic 6.5% |
| Barbadians | 0.0 /100 | #308 | Tragic 6.5% |
| Vietnamese | 0.0 /100 | #309 | Tragic 6.5% |
Demographics Similar to Immigrants from Austria by Unemployment
In terms of unemployment, the demographic groups most similar to Immigrants from Austria are Ukrainian (5.0%, a difference of 0.030%), Immigrants from South Africa (5.0%, a difference of 0.12%), Immigrants from Serbia (5.0%, a difference of 0.13%), Immigrants from Sudan (5.0%, a difference of 0.14%), and Immigrants from North Macedonia (5.0%, a difference of 0.16%).
| Demographics | Rating | Rank | Unemployment |
| Immigrants | Moldova | 96.6 /100 | #87 | Exceptional 5.0% |
| Immigrants | Korea | 96.6 /100 | #88 | Exceptional 5.0% |
| Jordanians | 96.4 /100 | #89 | Exceptional 5.0% |
| Immigrants | North Macedonia | 96.3 /100 | #90 | Exceptional 5.0% |
| Immigrants | Sudan | 96.3 /100 | #91 | Exceptional 5.0% |
| Immigrants | South Africa | 96.2 /100 | #92 | Exceptional 5.0% |
| Ukrainians | 96.0 /100 | #93 | Exceptional 5.0% |
| Immigrants | Austria | 95.9 /100 | #94 | Exceptional 5.0% |
| Immigrants | Serbia | 95.6 /100 | #95 | Exceptional 5.0% |
| Immigrants | England | 95.2 /100 | #96 | Exceptional 5.0% |
| Immigrants | Czechoslovakia | 95.1 /100 | #97 | Exceptional 5.0% |
| Romanians | 95.0 /100 | #98 | Exceptional 5.0% |
| Mongolians | 94.8 /100 | #99 | Exceptional 5.0% |
| Estonians | 94.6 /100 | #100 | Exceptional 5.0% |
| Americans | 94.3 /100 | #101 | Exceptional 5.0% |