Nigerian vs Immigrants from Uganda Unemployment
COMPARE
Nigerian
Immigrants from Uganda
Unemployment
Unemployment Comparison
Nigerians
Immigrants from Uganda
5.8%
UNEMPLOYMENT
0.1/ 100
METRIC RATING
265th/ 347
METRIC RANK
5.3%
UNEMPLOYMENT
37.8/ 100
METRIC RATING
186th/ 347
METRIC RANK
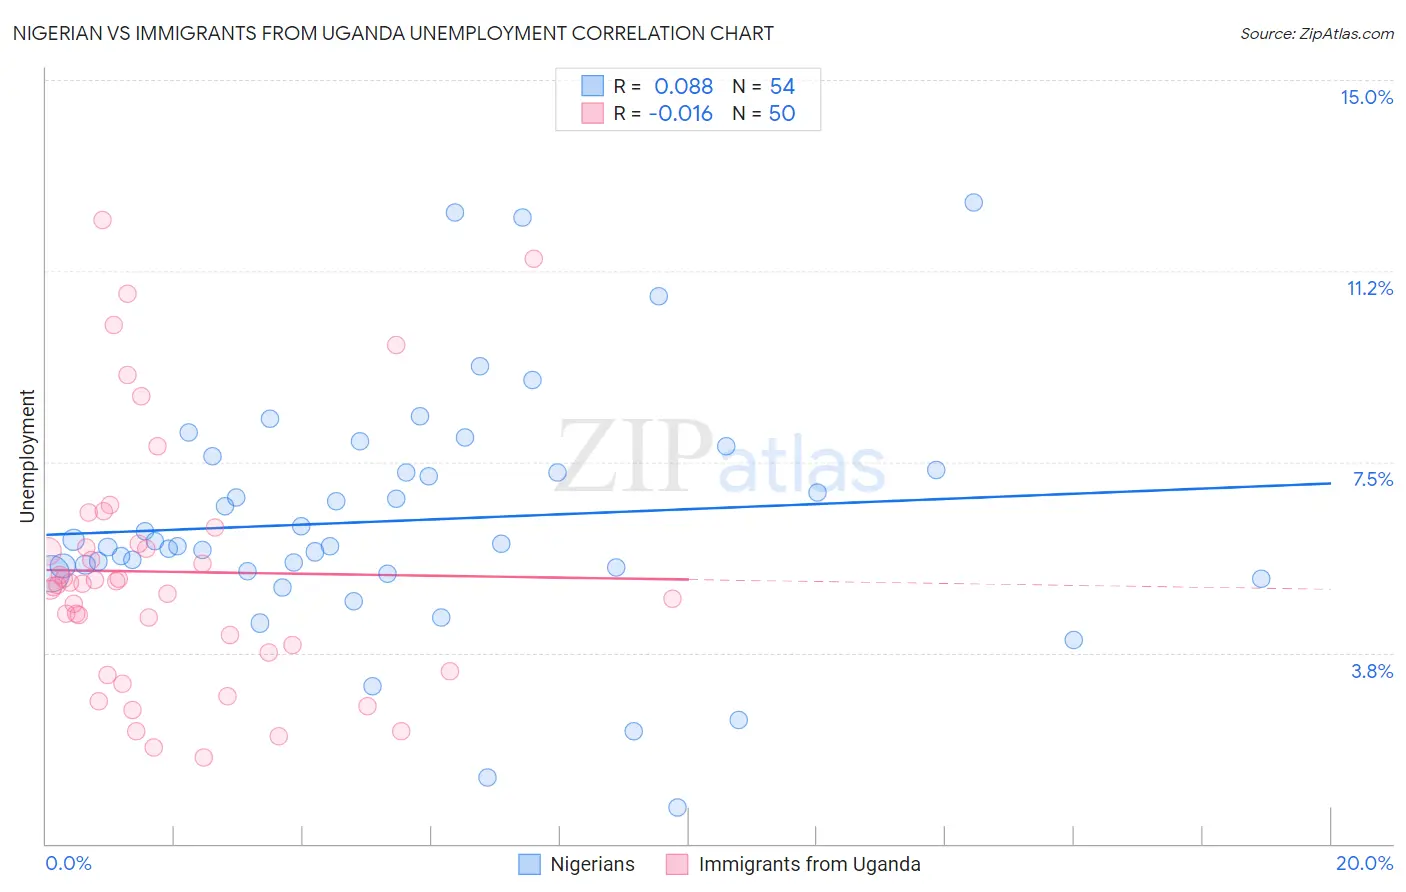
Nigerian vs Immigrants from Uganda Unemployment Correlation Chart
The statistical analysis conducted on geographies consisting of 332,601,343 people shows a slight positive correlation between the proportion of Nigerians and unemployment in the United States with a correlation coefficient (R) of 0.088 and weighted average of 5.8%. Similarly, the statistical analysis conducted on geographies consisting of 125,961,312 people shows no correlation between the proportion of Immigrants from Uganda and unemployment in the United States with a correlation coefficient (R) of -0.016 and weighted average of 5.3%, a difference of 9.7%.
Unemployment Correlation Summary
| Measurement | Nigerian | Immigrants from Uganda |
| Minimum | 0.70% | 1.7% |
| Maximum | 12.6% | 12.2% |
| Range | 11.9% | 10.5% |
| Mean | 6.3% | 5.3% |
| Median | 5.9% | 5.1% |
| Interquartile 25% (IQ1) | 5.4% | 3.7% |
| Interquartile 75% (IQ3) | 7.3% | 5.9% |
| Interquartile Range (IQR) | 2.0% | 2.2% |
| Standard Deviation (Sample) | 2.4% | 2.5% |
| Standard Deviation (Population) | 2.4% | 2.5% |
Similar Demographics by Unemployment
Demographics Similar to Nigerians by Unemployment
In terms of unemployment, the demographic groups most similar to Nigerians are Immigrants from Liberia (5.8%, a difference of 0.070%), Salvadoran (5.8%, a difference of 0.16%), Sierra Leonean (5.8%, a difference of 0.19%), Immigrants from Guatemala (5.8%, a difference of 0.30%), and Immigrants from Uzbekistan (5.8%, a difference of 0.32%).
| Demographics | Rating | Rank | Unemployment |
| Immigrants | Bahamas | 0.1 /100 | #258 | Tragic 5.8% |
| Sub-Saharan Africans | 0.1 /100 | #259 | Tragic 5.8% |
| Immigrants | Uzbekistan | 0.1 /100 | #260 | Tragic 5.8% |
| Immigrants | Guatemala | 0.1 /100 | #261 | Tragic 5.8% |
| Sierra Leoneans | 0.1 /100 | #262 | Tragic 5.8% |
| Salvadorans | 0.1 /100 | #263 | Tragic 5.8% |
| Immigrants | Liberia | 0.1 /100 | #264 | Tragic 5.8% |
| Nigerians | 0.1 /100 | #265 | Tragic 5.8% |
| Mexican American Indians | 0.1 /100 | #266 | Tragic 5.8% |
| Immigrants | Nigeria | 0.1 /100 | #267 | Tragic 5.8% |
| Immigrants | Sierra Leone | 0.1 /100 | #268 | Tragic 5.8% |
| Immigrants | El Salvador | 0.1 /100 | #269 | Tragic 5.8% |
| Blackfeet | 0.1 /100 | #270 | Tragic 5.8% |
| Mexicans | 0.1 /100 | #271 | Tragic 5.9% |
| Hispanics or Latinos | 0.0 /100 | #272 | Tragic 5.9% |
Demographics Similar to Immigrants from Uganda by Unemployment
In terms of unemployment, the demographic groups most similar to Immigrants from Uganda are Costa Rican (5.3%, a difference of 0.030%), Alsatian (5.3%, a difference of 0.050%), Immigrants from Thailand (5.3%, a difference of 0.070%), Assyrian/Chaldean/Syriac (5.3%, a difference of 0.090%), and Brazilian (5.3%, a difference of 0.15%).
| Demographics | Rating | Rank | Unemployment |
| Malaysians | 46.8 /100 | #179 | Average 5.3% |
| Immigrants | Greece | 45.0 /100 | #180 | Average 5.3% |
| Albanians | 43.5 /100 | #181 | Average 5.3% |
| Spaniards | 42.2 /100 | #182 | Average 5.3% |
| Brazilians | 40.2 /100 | #183 | Average 5.3% |
| Assyrians/Chaldeans/Syriacs | 39.2 /100 | #184 | Fair 5.3% |
| Immigrants | Thailand | 38.9 /100 | #185 | Fair 5.3% |
| Immigrants | Uganda | 37.8 /100 | #186 | Fair 5.3% |
| Costa Ricans | 37.4 /100 | #187 | Fair 5.3% |
| Alsatians | 37.0 /100 | #188 | Fair 5.3% |
| Immigrants | Belarus | 35.6 /100 | #189 | Fair 5.3% |
| Arabs | 35.3 /100 | #190 | Fair 5.3% |
| Somalis | 34.0 /100 | #191 | Fair 5.3% |
| South Americans | 33.9 /100 | #192 | Fair 5.3% |
| Immigrants | Somalia | 33.8 /100 | #193 | Fair 5.3% |