West Indian vs Immigrants from Uganda In Labor Force | Age 35-44
COMPARE
West Indian
Immigrants from Uganda
In Labor Force | Age 35-44
In Labor Force | Age 35-44 Comparison
West Indians
Immigrants from Uganda
83.9%
IN LABOR FORCE | AGE 35-44
2.4/ 100
METRIC RATING
236th/ 347
METRIC RANK
85.0%
IN LABOR FORCE | AGE 35-44
99.3/ 100
METRIC RATING
63rd/ 347
METRIC RANK
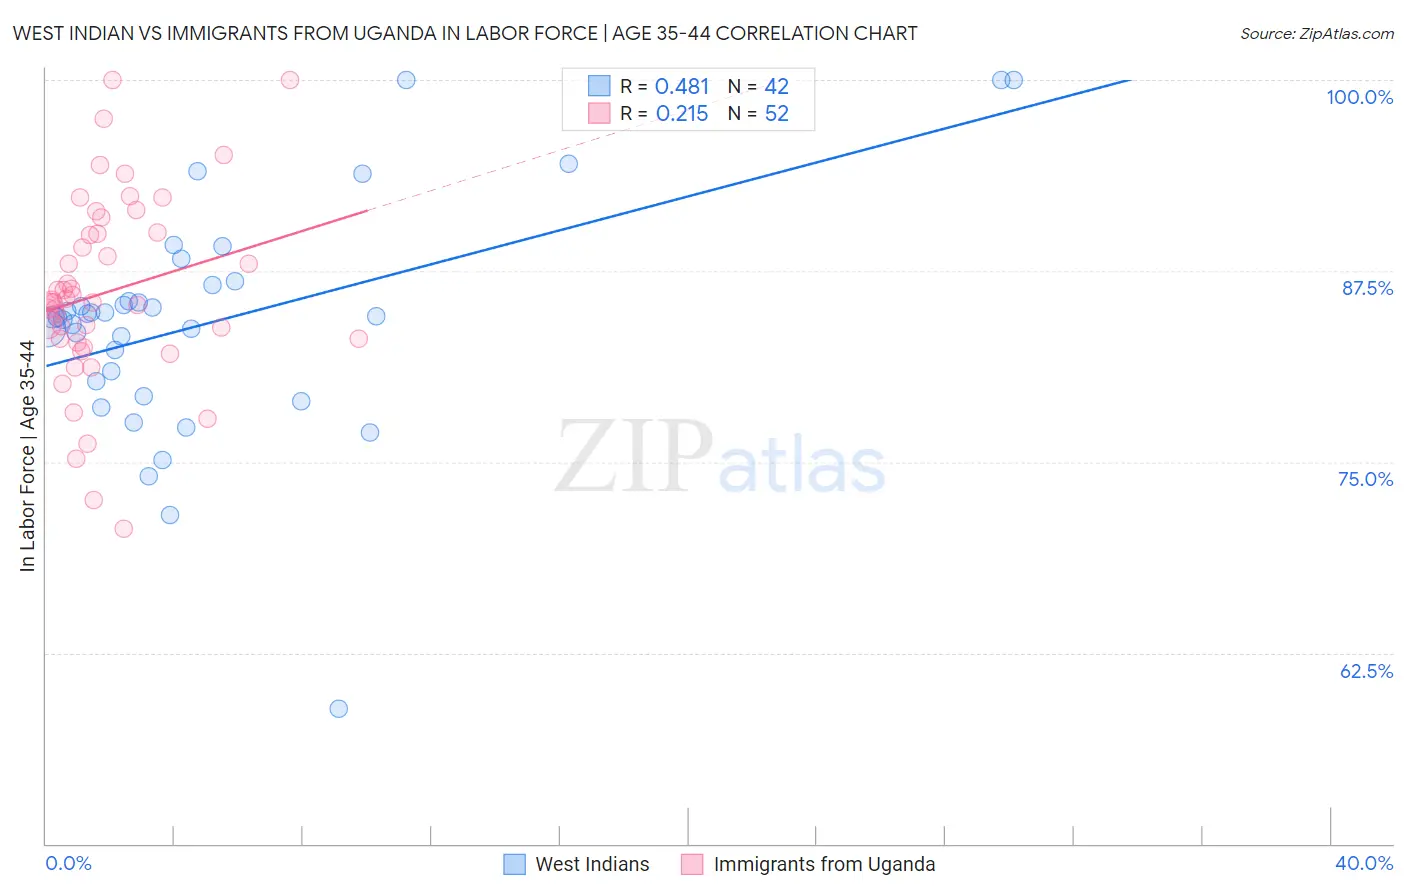
West Indian vs Immigrants from Uganda In Labor Force | Age 35-44 Correlation Chart
The statistical analysis conducted on geographies consisting of 253,906,051 people shows a moderate positive correlation between the proportion of West Indians and labor force participation rate among population between the ages 35 and 44 in the United States with a correlation coefficient (R) of 0.481 and weighted average of 83.9%. Similarly, the statistical analysis conducted on geographies consisting of 125,971,479 people shows a weak positive correlation between the proportion of Immigrants from Uganda and labor force participation rate among population between the ages 35 and 44 in the United States with a correlation coefficient (R) of 0.215 and weighted average of 85.0%, a difference of 1.4%.
In Labor Force | Age 35-44 Correlation Summary
| Measurement | West Indian | Immigrants from Uganda |
| Minimum | 58.8% | 70.6% |
| Maximum | 100.0% | 100.0% |
| Range | 41.2% | 29.4% |
| Mean | 84.2% | 86.1% |
| Median | 84.5% | 85.5% |
| Interquartile 25% (IQ1) | 80.3% | 82.9% |
| Interquartile 75% (IQ3) | 86.6% | 90.0% |
| Interquartile Range (IQR) | 6.3% | 7.0% |
| Standard Deviation (Sample) | 7.6% | 6.2% |
| Standard Deviation (Population) | 7.5% | 6.1% |
Similar Demographics by In Labor Force | Age 35-44
Demographics Similar to West Indians by In Labor Force | Age 35-44
In terms of in labor force | age 35-44, the demographic groups most similar to West Indians are Immigrants from Syria (83.9%, a difference of 0.0%), Immigrants from Oceania (83.9%, a difference of 0.020%), Immigrants from Germany (83.9%, a difference of 0.030%), Native Hawaiian (83.9%, a difference of 0.040%), and English (83.8%, a difference of 0.040%).
| Demographics | Rating | Rank | In Labor Force | Age 35-44 |
| Immigrants | Thailand | 4.7 /100 | #229 | Tragic 84.0% |
| Immigrants | Iraq | 3.7 /100 | #230 | Tragic 83.9% |
| Scottish | 3.2 /100 | #231 | Tragic 83.9% |
| Native Hawaiians | 3.0 /100 | #232 | Tragic 83.9% |
| Immigrants | Germany | 2.8 /100 | #233 | Tragic 83.9% |
| Immigrants | Oceania | 2.6 /100 | #234 | Tragic 83.9% |
| Immigrants | Syria | 2.5 /100 | #235 | Tragic 83.9% |
| West Indians | 2.4 /100 | #236 | Tragic 83.9% |
| English | 1.8 /100 | #237 | Tragic 83.8% |
| Immigrants | Laos | 1.7 /100 | #238 | Tragic 83.8% |
| Celtics | 1.4 /100 | #239 | Tragic 83.8% |
| Arabs | 1.3 /100 | #240 | Tragic 83.8% |
| Iraqis | 1.3 /100 | #241 | Tragic 83.8% |
| Immigrants | Cambodia | 1.1 /100 | #242 | Tragic 83.8% |
| Immigrants | Western Asia | 1.1 /100 | #243 | Tragic 83.8% |
Demographics Similar to Immigrants from Uganda by In Labor Force | Age 35-44
In terms of in labor force | age 35-44, the demographic groups most similar to Immigrants from Uganda are Immigrants from Moldova (85.0%, a difference of 0.0%), Immigrants from Latvia (85.0%, a difference of 0.010%), Swedish (85.0%, a difference of 0.010%), Immigrants from Brazil (85.0%, a difference of 0.020%), and Slovak (85.1%, a difference of 0.030%).
| Demographics | Rating | Rank | In Labor Force | Age 35-44 |
| Immigrants | Croatia | 99.5 /100 | #56 | Exceptional 85.1% |
| Chinese | 99.4 /100 | #57 | Exceptional 85.1% |
| Slovaks | 99.4 /100 | #58 | Exceptional 85.1% |
| Serbians | 99.4 /100 | #59 | Exceptional 85.1% |
| Albanians | 99.4 /100 | #60 | Exceptional 85.1% |
| Immigrants | Latvia | 99.3 /100 | #61 | Exceptional 85.0% |
| Immigrants | Moldova | 99.3 /100 | #62 | Exceptional 85.0% |
| Immigrants | Uganda | 99.3 /100 | #63 | Exceptional 85.0% |
| Swedes | 99.2 /100 | #64 | Exceptional 85.0% |
| Immigrants | Brazil | 99.2 /100 | #65 | Exceptional 85.0% |
| Immigrants | Haiti | 99.1 /100 | #66 | Exceptional 85.0% |
| Immigrants | Italy | 99.1 /100 | #67 | Exceptional 85.0% |
| Italians | 99.1 /100 | #68 | Exceptional 85.0% |
| Sudanese | 99.0 /100 | #69 | Exceptional 85.0% |
| Brazilians | 99.0 /100 | #70 | Exceptional 85.0% |