Welsh vs Immigrants from Sudan Female Unemployment
COMPARE
Welsh
Immigrants from Sudan
Female Unemployment
Female Unemployment Comparison
Welsh
Immigrants from Sudan
4.7%
FEMALE UNEMPLOYMENT
99.9/ 100
METRIC RATING
24th/ 347
METRIC RANK
5.0%
FEMALE UNEMPLOYMENT
96.7/ 100
METRIC RATING
88th/ 347
METRIC RANK
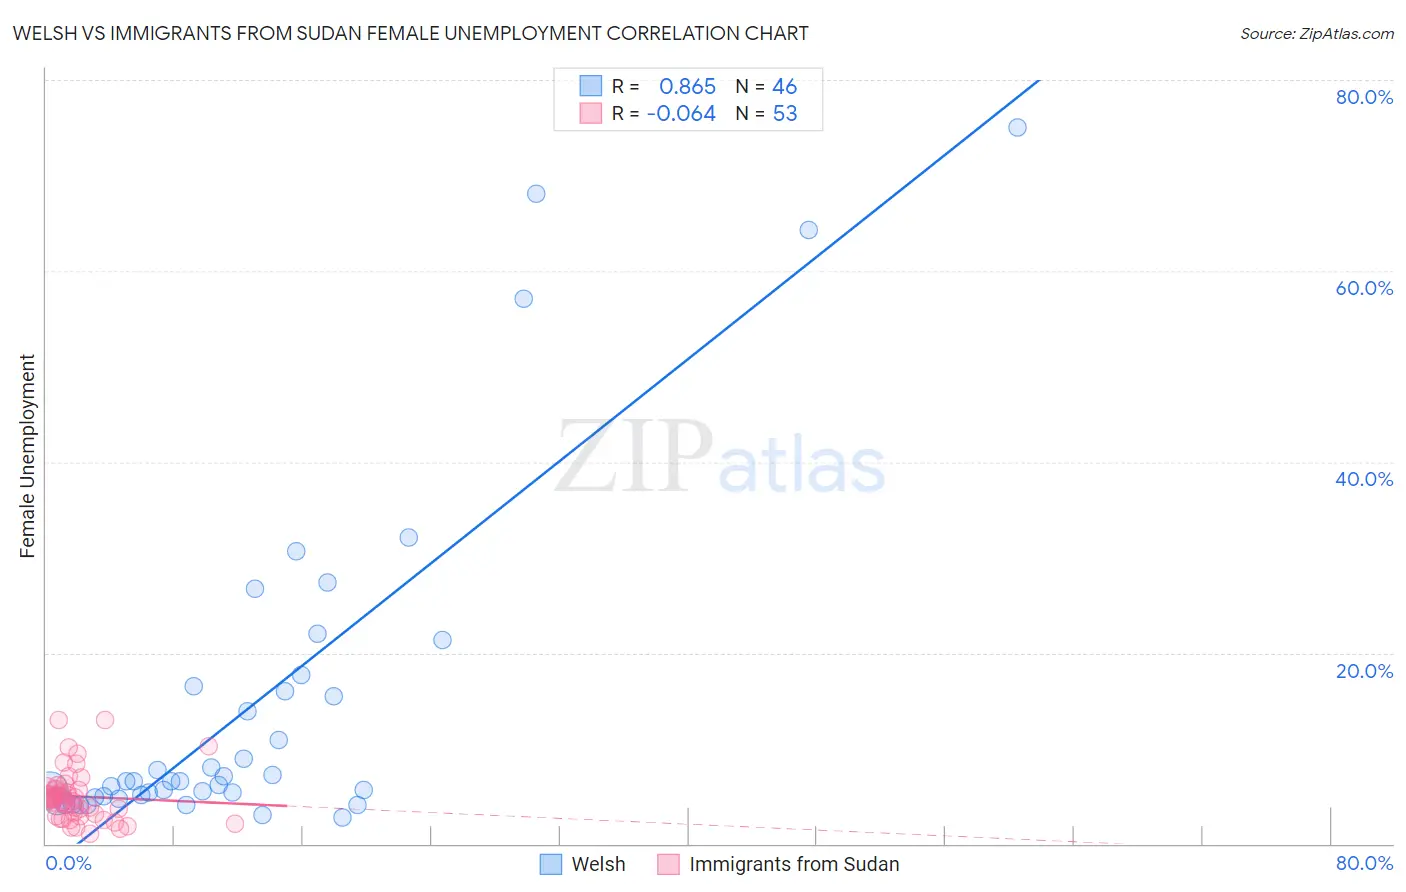
Welsh vs Immigrants from Sudan Female Unemployment Correlation Chart
The statistical analysis conducted on geographies consisting of 519,058,145 people shows a very strong positive correlation between the proportion of Welsh and unemploymnet rate among females in the United States with a correlation coefficient (R) of 0.865 and weighted average of 4.7%. Similarly, the statistical analysis conducted on geographies consisting of 118,886,024 people shows a slight negative correlation between the proportion of Immigrants from Sudan and unemploymnet rate among females in the United States with a correlation coefficient (R) of -0.064 and weighted average of 5.0%, a difference of 5.6%.
Female Unemployment Correlation Summary
| Measurement | Welsh | Immigrants from Sudan |
| Minimum | 2.8% | 1.1% |
| Maximum | 75.0% | 13.0% |
| Range | 72.2% | 11.9% |
| Mean | 14.8% | 5.0% |
| Median | 6.5% | 4.7% |
| Interquartile 25% (IQ1) | 5.0% | 3.0% |
| Interquartile 75% (IQ3) | 16.5% | 5.7% |
| Interquartile Range (IQR) | 11.5% | 2.7% |
| Standard Deviation (Sample) | 17.8% | 2.6% |
| Standard Deviation (Population) | 17.7% | 2.6% |
Similar Demographics by Female Unemployment
Demographics Similar to Welsh by Female Unemployment
In terms of female unemployment, the demographic groups most similar to Welsh are Immigrants from India (4.7%, a difference of 0.090%), Immigrants from Bosnia and Herzegovina (4.7%, a difference of 0.13%), Scottish (4.7%, a difference of 0.21%), British (4.7%, a difference of 0.29%), and Irish (4.7%, a difference of 0.32%).
| Demographics | Rating | Rank | Female Unemployment |
| Croatians | 99.9 /100 | #17 | Exceptional 4.7% |
| Latvians | 99.9 /100 | #18 | Exceptional 4.7% |
| Poles | 99.9 /100 | #19 | Exceptional 4.7% |
| Bulgarians | 99.9 /100 | #20 | Exceptional 4.7% |
| Fijians | 99.9 /100 | #21 | Exceptional 4.7% |
| Europeans | 99.9 /100 | #22 | Exceptional 4.7% |
| Scottish | 99.9 /100 | #23 | Exceptional 4.7% |
| Welsh | 99.9 /100 | #24 | Exceptional 4.7% |
| Immigrants | India | 99.9 /100 | #25 | Exceptional 4.7% |
| Immigrants | Bosnia and Herzegovina | 99.9 /100 | #26 | Exceptional 4.7% |
| British | 99.9 /100 | #27 | Exceptional 4.7% |
| Irish | 99.9 /100 | #28 | Exceptional 4.7% |
| Cypriots | 99.9 /100 | #29 | Exceptional 4.7% |
| Lithuanians | 99.8 /100 | #30 | Exceptional 4.7% |
| Sudanese | 99.8 /100 | #31 | Exceptional 4.8% |
Demographics Similar to Immigrants from Sudan by Female Unemployment
In terms of female unemployment, the demographic groups most similar to Immigrants from Sudan are Immigrants from Taiwan (5.0%, a difference of 0.060%), Venezuelan (5.0%, a difference of 0.090%), Bolivian (5.0%, a difference of 0.18%), Ukrainian (5.0%, a difference of 0.19%), and Immigrants from Sweden (5.0%, a difference of 0.22%).
| Demographics | Rating | Rank | Female Unemployment |
| Filipinos | 97.3 /100 | #81 | Exceptional 5.0% |
| Immigrants | Australia | 97.3 /100 | #82 | Exceptional 5.0% |
| Immigrants | Serbia | 97.2 /100 | #83 | Exceptional 5.0% |
| Canadians | 97.2 /100 | #84 | Exceptional 5.0% |
| Ukrainians | 97.1 /100 | #85 | Exceptional 5.0% |
| Bolivians | 97.1 /100 | #86 | Exceptional 5.0% |
| Venezuelans | 96.9 /100 | #87 | Exceptional 5.0% |
| Immigrants | Sudan | 96.7 /100 | #88 | Exceptional 5.0% |
| Immigrants | Taiwan | 96.6 /100 | #89 | Exceptional 5.0% |
| Immigrants | Sweden | 96.3 /100 | #90 | Exceptional 5.0% |
| Immigrants | Japan | 96.0 /100 | #91 | Exceptional 5.0% |
| Romanians | 95.9 /100 | #92 | Exceptional 5.0% |
| Immigrants | Austria | 95.7 /100 | #93 | Exceptional 5.0% |
| Immigrants | Malaysia | 95.7 /100 | #94 | Exceptional 5.0% |
| Burmese | 95.6 /100 | #95 | Exceptional 5.0% |