Welsh vs Marshallese Female Unemployment
COMPARE
Welsh
Marshallese
Female Unemployment
Female Unemployment Comparison
Welsh
Marshallese
4.7%
FEMALE UNEMPLOYMENT
99.9/ 100
METRIC RATING
24th/ 347
METRIC RANK
5.6%
FEMALE UNEMPLOYMENT
2.3/ 100
METRIC RATING
242nd/ 347
METRIC RANK
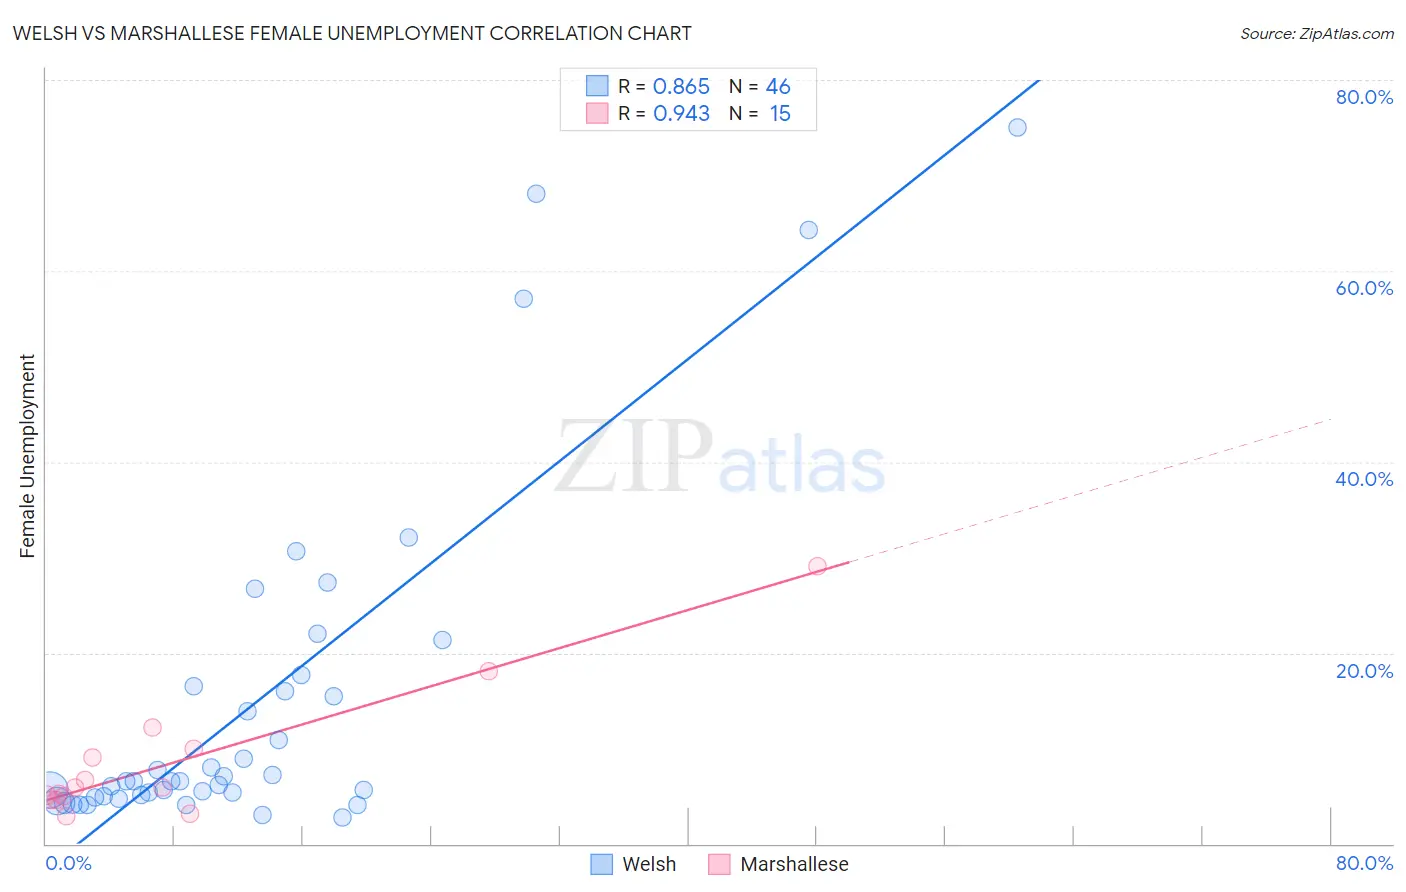
Welsh vs Marshallese Female Unemployment Correlation Chart
The statistical analysis conducted on geographies consisting of 519,058,145 people shows a very strong positive correlation between the proportion of Welsh and unemploymnet rate among females in the United States with a correlation coefficient (R) of 0.865 and weighted average of 4.7%. Similarly, the statistical analysis conducted on geographies consisting of 14,756,789 people shows a near-perfect positive correlation between the proportion of Marshallese and unemploymnet rate among females in the United States with a correlation coefficient (R) of 0.943 and weighted average of 5.6%, a difference of 17.6%.
Female Unemployment Correlation Summary
| Measurement | Welsh | Marshallese |
| Minimum | 2.8% | 2.9% |
| Maximum | 75.0% | 29.1% |
| Range | 72.2% | 26.2% |
| Mean | 14.8% | 8.5% |
| Median | 6.5% | 5.9% |
| Interquartile 25% (IQ1) | 5.0% | 4.6% |
| Interquartile 75% (IQ3) | 16.5% | 10.0% |
| Interquartile Range (IQR) | 11.5% | 5.4% |
| Standard Deviation (Sample) | 17.8% | 6.9% |
| Standard Deviation (Population) | 17.7% | 6.7% |
Similar Demographics by Female Unemployment
Demographics Similar to Welsh by Female Unemployment
In terms of female unemployment, the demographic groups most similar to Welsh are Immigrants from India (4.7%, a difference of 0.090%), Immigrants from Bosnia and Herzegovina (4.7%, a difference of 0.13%), Scottish (4.7%, a difference of 0.21%), British (4.7%, a difference of 0.29%), and Irish (4.7%, a difference of 0.32%).
| Demographics | Rating | Rank | Female Unemployment |
| Croatians | 99.9 /100 | #17 | Exceptional 4.7% |
| Latvians | 99.9 /100 | #18 | Exceptional 4.7% |
| Poles | 99.9 /100 | #19 | Exceptional 4.7% |
| Bulgarians | 99.9 /100 | #20 | Exceptional 4.7% |
| Fijians | 99.9 /100 | #21 | Exceptional 4.7% |
| Europeans | 99.9 /100 | #22 | Exceptional 4.7% |
| Scottish | 99.9 /100 | #23 | Exceptional 4.7% |
| Welsh | 99.9 /100 | #24 | Exceptional 4.7% |
| Immigrants | India | 99.9 /100 | #25 | Exceptional 4.7% |
| Immigrants | Bosnia and Herzegovina | 99.9 /100 | #26 | Exceptional 4.7% |
| British | 99.9 /100 | #27 | Exceptional 4.7% |
| Irish | 99.9 /100 | #28 | Exceptional 4.7% |
| Cypriots | 99.9 /100 | #29 | Exceptional 4.7% |
| Lithuanians | 99.8 /100 | #30 | Exceptional 4.7% |
| Sudanese | 99.8 /100 | #31 | Exceptional 4.8% |
Demographics Similar to Marshallese by Female Unemployment
In terms of female unemployment, the demographic groups most similar to Marshallese are Spanish American (5.6%, a difference of 0.010%), South American Indian (5.5%, a difference of 0.32%), Immigrants from South America (5.5%, a difference of 0.37%), Aleut (5.5%, a difference of 0.40%), and Sierra Leonean (5.5%, a difference of 0.50%).
| Demographics | Rating | Rank | Female Unemployment |
| Immigrants | Iran | 3.3 /100 | #235 | Tragic 5.5% |
| Immigrants | Cambodia | 3.3 /100 | #236 | Tragic 5.5% |
| Immigrants | Panama | 3.2 /100 | #237 | Tragic 5.5% |
| Sierra Leoneans | 3.2 /100 | #238 | Tragic 5.5% |
| Aleuts | 3.0 /100 | #239 | Tragic 5.5% |
| Immigrants | South America | 2.9 /100 | #240 | Tragic 5.5% |
| South American Indians | 2.8 /100 | #241 | Tragic 5.5% |
| Marshallese | 2.3 /100 | #242 | Tragic 5.6% |
| Spanish Americans | 2.2 /100 | #243 | Tragic 5.6% |
| Immigrants | Liberia | 1.5 /100 | #244 | Tragic 5.6% |
| Guamanians/Chamorros | 1.4 /100 | #245 | Tragic 5.6% |
| Japanese | 1.2 /100 | #246 | Tragic 5.6% |
| Immigrants | Western Asia | 1.1 /100 | #247 | Tragic 5.6% |
| Cree | 1.0 /100 | #248 | Tragic 5.6% |
| Immigrants | Uzbekistan | 1.0 /100 | #249 | Tragic 5.6% |