Welsh vs Assyrian/Chaldean/Syriac Female Unemployment
COMPARE
Welsh
Assyrian/Chaldean/Syriac
Female Unemployment
Female Unemployment Comparison
Welsh
Assyrians/Chaldeans/Syriacs
4.7%
FEMALE UNEMPLOYMENT
99.9/ 100
METRIC RATING
24th/ 347
METRIC RANK
5.6%
FEMALE UNEMPLOYMENT
0.8/ 100
METRIC RATING
251st/ 347
METRIC RANK
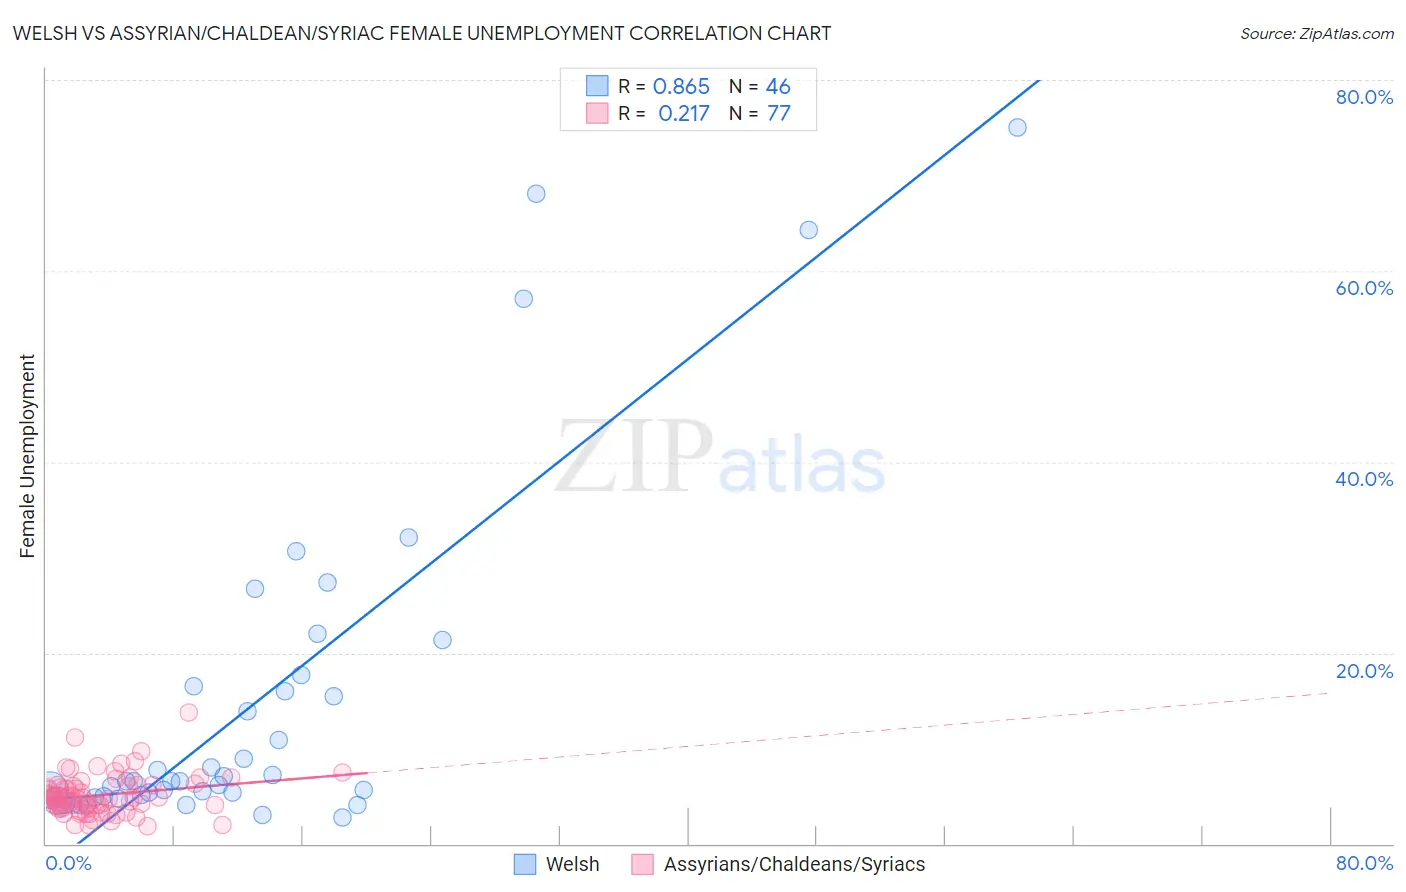
Welsh vs Assyrian/Chaldean/Syriac Female Unemployment Correlation Chart
The statistical analysis conducted on geographies consisting of 519,058,145 people shows a very strong positive correlation between the proportion of Welsh and unemploymnet rate among females in the United States with a correlation coefficient (R) of 0.865 and weighted average of 4.7%. Similarly, the statistical analysis conducted on geographies consisting of 110,254,844 people shows a weak positive correlation between the proportion of Assyrians/Chaldeans/Syriacs and unemploymnet rate among females in the United States with a correlation coefficient (R) of 0.217 and weighted average of 5.6%, a difference of 19.5%.
Female Unemployment Correlation Summary
| Measurement | Welsh | Assyrian/Chaldean/Syriac |
| Minimum | 2.8% | 1.8% |
| Maximum | 75.0% | 13.8% |
| Range | 72.2% | 12.0% |
| Mean | 14.8% | 5.1% |
| Median | 6.5% | 4.8% |
| Interquartile 25% (IQ1) | 5.0% | 3.8% |
| Interquartile 75% (IQ3) | 16.5% | 6.1% |
| Interquartile Range (IQR) | 11.5% | 2.3% |
| Standard Deviation (Sample) | 17.8% | 2.1% |
| Standard Deviation (Population) | 17.7% | 2.1% |
Similar Demographics by Female Unemployment
Demographics Similar to Welsh by Female Unemployment
In terms of female unemployment, the demographic groups most similar to Welsh are Immigrants from India (4.7%, a difference of 0.090%), Immigrants from Bosnia and Herzegovina (4.7%, a difference of 0.13%), Scottish (4.7%, a difference of 0.21%), British (4.7%, a difference of 0.29%), and Irish (4.7%, a difference of 0.32%).
| Demographics | Rating | Rank | Female Unemployment |
| Croatians | 99.9 /100 | #17 | Exceptional 4.7% |
| Latvians | 99.9 /100 | #18 | Exceptional 4.7% |
| Poles | 99.9 /100 | #19 | Exceptional 4.7% |
| Bulgarians | 99.9 /100 | #20 | Exceptional 4.7% |
| Fijians | 99.9 /100 | #21 | Exceptional 4.7% |
| Europeans | 99.9 /100 | #22 | Exceptional 4.7% |
| Scottish | 99.9 /100 | #23 | Exceptional 4.7% |
| Welsh | 99.9 /100 | #24 | Exceptional 4.7% |
| Immigrants | India | 99.9 /100 | #25 | Exceptional 4.7% |
| Immigrants | Bosnia and Herzegovina | 99.9 /100 | #26 | Exceptional 4.7% |
| British | 99.9 /100 | #27 | Exceptional 4.7% |
| Irish | 99.9 /100 | #28 | Exceptional 4.7% |
| Cypriots | 99.9 /100 | #29 | Exceptional 4.7% |
| Lithuanians | 99.8 /100 | #30 | Exceptional 4.7% |
| Sudanese | 99.8 /100 | #31 | Exceptional 4.8% |
Demographics Similar to Assyrians/Chaldeans/Syriacs by Female Unemployment
In terms of female unemployment, the demographic groups most similar to Assyrians/Chaldeans/Syriacs are Immigrants from Syria (5.6%, a difference of 0.060%), Cajun (5.7%, a difference of 0.20%), Immigrants from Sierra Leone (5.7%, a difference of 0.34%), Immigrants (5.7%, a difference of 0.34%), and Immigrants from Uzbekistan (5.6%, a difference of 0.35%).
| Demographics | Rating | Rank | Female Unemployment |
| Immigrants | Liberia | 1.5 /100 | #244 | Tragic 5.6% |
| Guamanians/Chamorros | 1.4 /100 | #245 | Tragic 5.6% |
| Japanese | 1.2 /100 | #246 | Tragic 5.6% |
| Immigrants | Western Asia | 1.1 /100 | #247 | Tragic 5.6% |
| Cree | 1.0 /100 | #248 | Tragic 5.6% |
| Immigrants | Uzbekistan | 1.0 /100 | #249 | Tragic 5.6% |
| Immigrants | Syria | 0.8 /100 | #250 | Tragic 5.6% |
| Assyrians/Chaldeans/Syriacs | 0.8 /100 | #251 | Tragic 5.6% |
| Cajuns | 0.7 /100 | #252 | Tragic 5.7% |
| Immigrants | Sierra Leone | 0.6 /100 | #253 | Tragic 5.7% |
| Immigrants | Immigrants | 0.6 /100 | #254 | Tragic 5.7% |
| Immigrants | Cameroon | 0.6 /100 | #255 | Tragic 5.7% |
| Sub-Saharan Africans | 0.4 /100 | #256 | Tragic 5.7% |
| Dutch West Indians | 0.3 /100 | #257 | Tragic 5.7% |
| Immigrants | Portugal | 0.2 /100 | #258 | Tragic 5.8% |