Nicaraguan vs Marshallese Female Unemployment
COMPARE
Nicaraguan
Marshallese
Female Unemployment
Female Unemployment Comparison
Nicaraguans
Marshallese
5.5%
FEMALE UNEMPLOYMENT
7.2/ 100
METRIC RATING
222nd/ 347
METRIC RANK
5.6%
FEMALE UNEMPLOYMENT
2.3/ 100
METRIC RATING
242nd/ 347
METRIC RANK
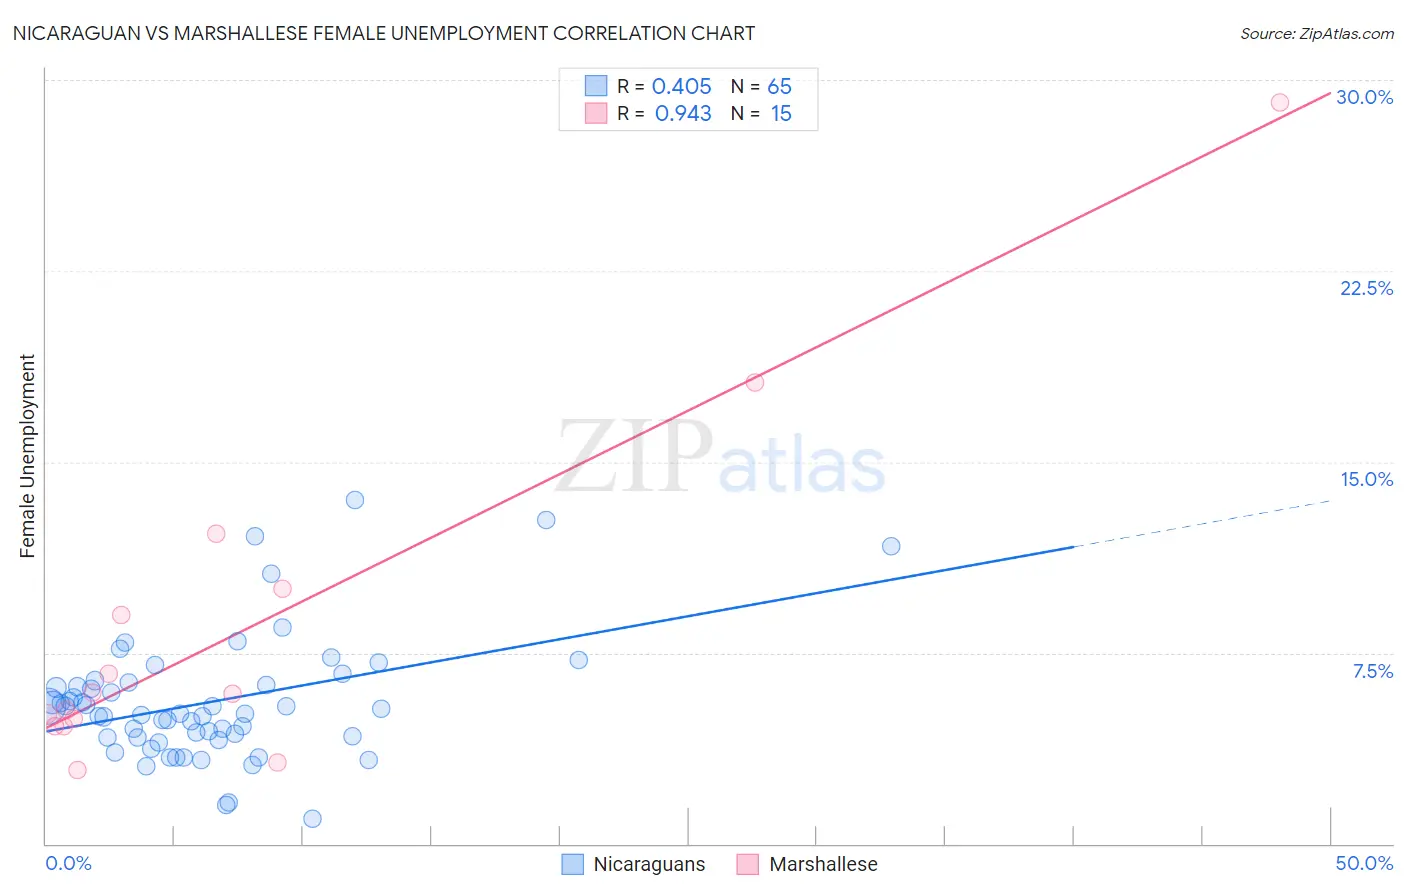
Nicaraguan vs Marshallese Female Unemployment Correlation Chart
The statistical analysis conducted on geographies consisting of 285,135,127 people shows a moderate positive correlation between the proportion of Nicaraguans and unemploymnet rate among females in the United States with a correlation coefficient (R) of 0.405 and weighted average of 5.5%. Similarly, the statistical analysis conducted on geographies consisting of 14,756,789 people shows a near-perfect positive correlation between the proportion of Marshallese and unemploymnet rate among females in the United States with a correlation coefficient (R) of 0.943 and weighted average of 5.6%, a difference of 1.8%.
Female Unemployment Correlation Summary
| Measurement | Nicaraguan | Marshallese |
| Minimum | 1.0% | 2.9% |
| Maximum | 13.5% | 29.1% |
| Range | 12.5% | 26.2% |
| Mean | 5.6% | 8.5% |
| Median | 5.1% | 5.9% |
| Interquartile 25% (IQ1) | 4.2% | 4.6% |
| Interquartile 75% (IQ3) | 6.3% | 10.0% |
| Interquartile Range (IQR) | 2.1% | 5.4% |
| Standard Deviation (Sample) | 2.4% | 6.9% |
| Standard Deviation (Population) | 2.4% | 6.7% |
Demographics Similar to Nicaraguans and Marshallese by Female Unemployment
In terms of female unemployment, the demographic groups most similar to Nicaraguans are Delaware (5.5%, a difference of 0.010%), Iraqi (5.5%, a difference of 0.040%), French American Indian (5.5%, a difference of 0.27%), Immigrants from Peru (5.5%, a difference of 0.31%), and Immigrants from Philippines (5.5%, a difference of 0.48%). Similarly, the demographic groups most similar to Marshallese are South American Indian (5.5%, a difference of 0.32%), Immigrants from South America (5.5%, a difference of 0.37%), Aleut (5.5%, a difference of 0.40%), Sierra Leonean (5.5%, a difference of 0.50%), and Immigrants from Panama (5.5%, a difference of 0.52%).
| Demographics | Rating | Rank | Female Unemployment |
| Nicaraguans | 7.2 /100 | #222 | Tragic 5.5% |
| Delaware | 7.2 /100 | #223 | Tragic 5.5% |
| Iraqis | 7.1 /100 | #224 | Tragic 5.5% |
| French American Indians | 6.1 /100 | #225 | Tragic 5.5% |
| Immigrants | Peru | 5.9 /100 | #226 | Tragic 5.5% |
| Immigrants | Philippines | 5.3 /100 | #227 | Tragic 5.5% |
| Israelis | 4.8 /100 | #228 | Tragic 5.5% |
| Panamanians | 4.7 /100 | #229 | Tragic 5.5% |
| Immigrants | Uruguay | 4.7 /100 | #230 | Tragic 5.5% |
| Immigrants | Iraq | 3.9 /100 | #231 | Tragic 5.5% |
| Liberians | 3.9 /100 | #232 | Tragic 5.5% |
| Moroccans | 3.4 /100 | #233 | Tragic 5.5% |
| Immigrants | Lebanon | 3.3 /100 | #234 | Tragic 5.5% |
| Immigrants | Iran | 3.3 /100 | #235 | Tragic 5.5% |
| Immigrants | Cambodia | 3.3 /100 | #236 | Tragic 5.5% |
| Immigrants | Panama | 3.2 /100 | #237 | Tragic 5.5% |
| Sierra Leoneans | 3.2 /100 | #238 | Tragic 5.5% |
| Aleuts | 3.0 /100 | #239 | Tragic 5.5% |
| Immigrants | South America | 2.9 /100 | #240 | Tragic 5.5% |
| South American Indians | 2.8 /100 | #241 | Tragic 5.5% |
| Marshallese | 2.3 /100 | #242 | Tragic 5.6% |