Immigrants from Jordan vs Marshallese Female Unemployment
COMPARE
Immigrants from Jordan
Marshallese
Female Unemployment
Female Unemployment Comparison
Immigrants from Jordan
Marshallese
5.1%
FEMALE UNEMPLOYMENT
80.4/ 100
METRIC RATING
144th/ 347
METRIC RANK
5.6%
FEMALE UNEMPLOYMENT
2.3/ 100
METRIC RATING
242nd/ 347
METRIC RANK
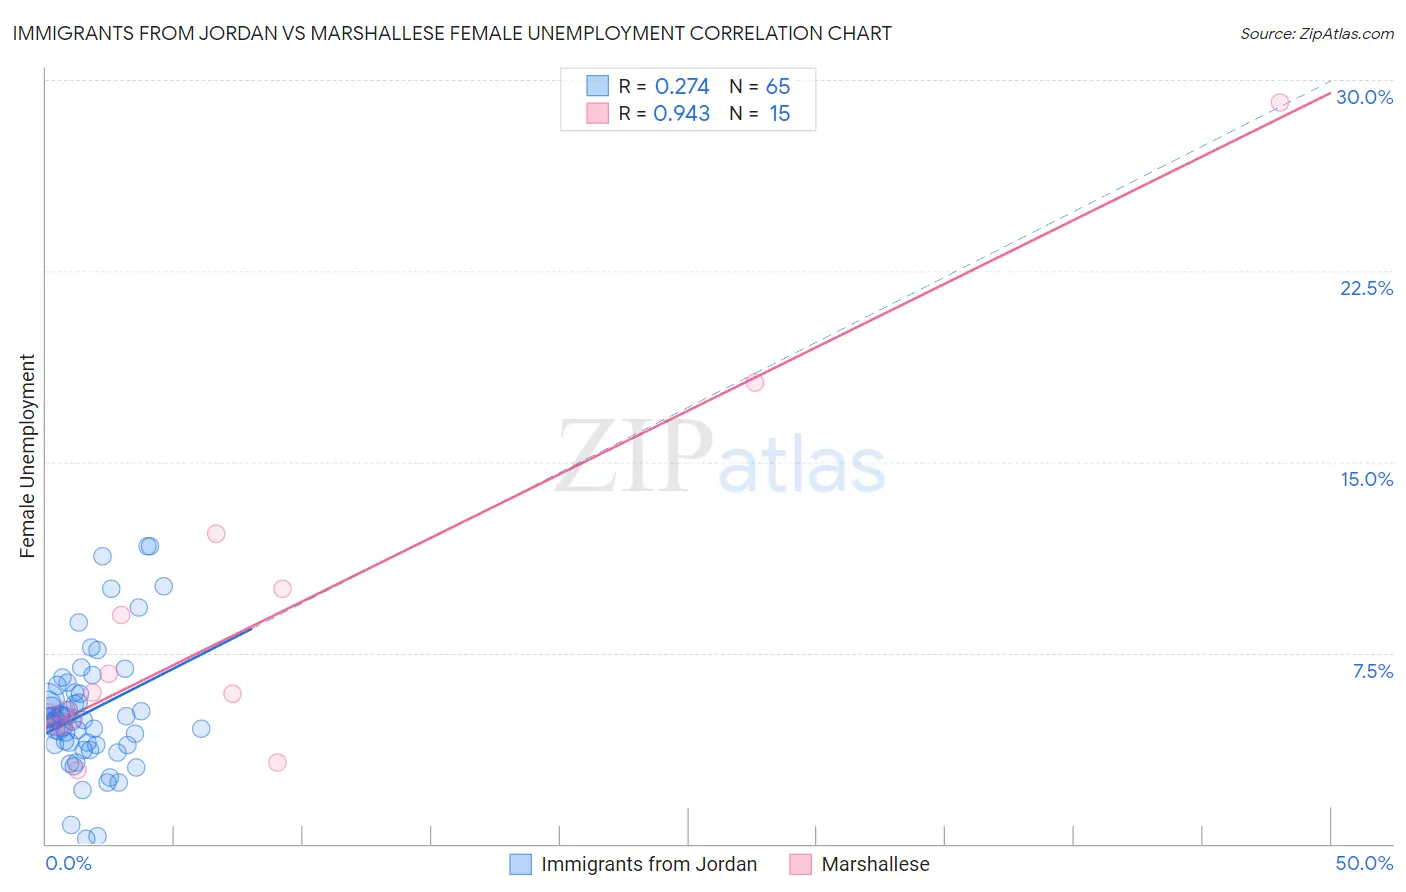
Immigrants from Jordan vs Marshallese Female Unemployment Correlation Chart
The statistical analysis conducted on geographies consisting of 181,116,498 people shows a weak positive correlation between the proportion of Immigrants from Jordan and unemploymnet rate among females in the United States with a correlation coefficient (R) of 0.274 and weighted average of 5.1%. Similarly, the statistical analysis conducted on geographies consisting of 14,756,789 people shows a near-perfect positive correlation between the proportion of Marshallese and unemploymnet rate among females in the United States with a correlation coefficient (R) of 0.943 and weighted average of 5.6%, a difference of 8.0%.
Female Unemployment Correlation Summary
| Measurement | Immigrants from Jordan | Marshallese |
| Minimum | 0.20% | 2.9% |
| Maximum | 11.7% | 29.1% |
| Range | 11.5% | 26.2% |
| Mean | 5.2% | 8.5% |
| Median | 4.9% | 5.9% |
| Interquartile 25% (IQ1) | 3.9% | 4.6% |
| Interquartile 75% (IQ3) | 5.9% | 10.0% |
| Interquartile Range (IQR) | 2.0% | 5.4% |
| Standard Deviation (Sample) | 2.4% | 6.9% |
| Standard Deviation (Population) | 2.4% | 6.7% |
Similar Demographics by Female Unemployment
Demographics Similar to Immigrants from Jordan by Female Unemployment
In terms of female unemployment, the demographic groups most similar to Immigrants from Jordan are Immigrants from Kazakhstan (5.1%, a difference of 0.030%), Palestinian (5.1%, a difference of 0.040%), Immigrants from Oceania (5.2%, a difference of 0.090%), Immigrants from Norway (5.2%, a difference of 0.10%), and Immigrants from Eastern Europe (5.1%, a difference of 0.11%).
| Demographics | Rating | Rank | Female Unemployment |
| Pakistanis | 83.8 /100 | #137 | Excellent 5.1% |
| Chickasaw | 83.2 /100 | #138 | Excellent 5.1% |
| Immigrants | Eastern Asia | 83.0 /100 | #139 | Excellent 5.1% |
| Immigrants | France | 82.7 /100 | #140 | Excellent 5.1% |
| Immigrants | Eastern Europe | 81.5 /100 | #141 | Excellent 5.1% |
| Palestinians | 80.8 /100 | #142 | Excellent 5.1% |
| Immigrants | Kazakhstan | 80.7 /100 | #143 | Excellent 5.1% |
| Immigrants | Jordan | 80.4 /100 | #144 | Excellent 5.1% |
| Immigrants | Oceania | 79.5 /100 | #145 | Good 5.2% |
| Immigrants | Norway | 79.4 /100 | #146 | Good 5.2% |
| Argentineans | 79.2 /100 | #147 | Good 5.2% |
| Immigrants | Argentina | 78.7 /100 | #148 | Good 5.2% |
| Asians | 78.3 /100 | #149 | Good 5.2% |
| Egyptians | 78.3 /100 | #150 | Good 5.2% |
| Immigrants | China | 75.9 /100 | #151 | Good 5.2% |
Demographics Similar to Marshallese by Female Unemployment
In terms of female unemployment, the demographic groups most similar to Marshallese are Spanish American (5.6%, a difference of 0.010%), South American Indian (5.5%, a difference of 0.32%), Immigrants from South America (5.5%, a difference of 0.37%), Aleut (5.5%, a difference of 0.40%), and Sierra Leonean (5.5%, a difference of 0.50%).
| Demographics | Rating | Rank | Female Unemployment |
| Immigrants | Iran | 3.3 /100 | #235 | Tragic 5.5% |
| Immigrants | Cambodia | 3.3 /100 | #236 | Tragic 5.5% |
| Immigrants | Panama | 3.2 /100 | #237 | Tragic 5.5% |
| Sierra Leoneans | 3.2 /100 | #238 | Tragic 5.5% |
| Aleuts | 3.0 /100 | #239 | Tragic 5.5% |
| Immigrants | South America | 2.9 /100 | #240 | Tragic 5.5% |
| South American Indians | 2.8 /100 | #241 | Tragic 5.5% |
| Marshallese | 2.3 /100 | #242 | Tragic 5.6% |
| Spanish Americans | 2.2 /100 | #243 | Tragic 5.6% |
| Immigrants | Liberia | 1.5 /100 | #244 | Tragic 5.6% |
| Guamanians/Chamorros | 1.4 /100 | #245 | Tragic 5.6% |
| Japanese | 1.2 /100 | #246 | Tragic 5.6% |
| Immigrants | Western Asia | 1.1 /100 | #247 | Tragic 5.6% |
| Cree | 1.0 /100 | #248 | Tragic 5.6% |
| Immigrants | Uzbekistan | 1.0 /100 | #249 | Tragic 5.6% |