Welsh vs Marshallese 3rd Grade
COMPARE
Welsh
Marshallese
3rd Grade
3rd Grade Comparison
Welsh
Marshallese
98.8%
3RD GRADE
100.0/ 100
METRIC RATING
3rd/ 347
METRIC RANK
97.8%
3RD GRADE
57.2/ 100
METRIC RATING
163rd/ 347
METRIC RANK
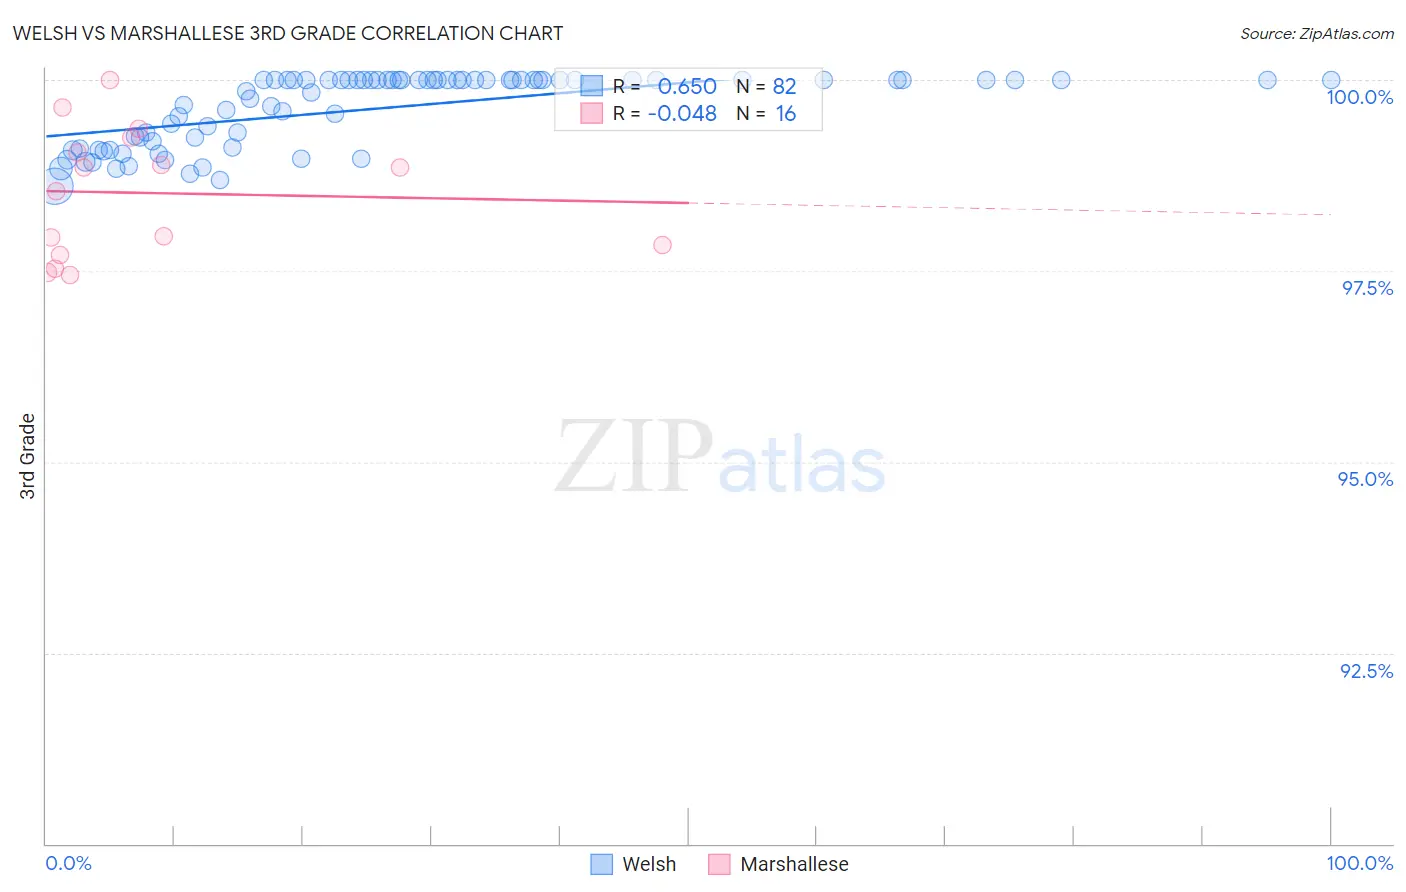
Welsh vs Marshallese 3rd Grade Correlation Chart
The statistical analysis conducted on geographies consisting of 239,959,962 people shows a significant positive correlation between the proportion of Welsh and percentage of population with at least 3rd grade education in the United States with a correlation coefficient (R) of 0.650 and weighted average of 98.8%. Similarly, the statistical analysis conducted on geographies consisting of 14,761,315 people shows no correlation between the proportion of Marshallese and percentage of population with at least 3rd grade education in the United States with a correlation coefficient (R) of -0.048 and weighted average of 97.8%, a difference of 1.0%.
3rd Grade Correlation Summary
| Measurement | Welsh | Marshallese |
| Minimum | 98.6% | 97.4% |
| Maximum | 100.0% | 100.0% |
| Range | 1.4% | 2.6% |
| Mean | 99.6% | 98.5% |
| Median | 100.0% | 98.7% |
| Interquartile 25% (IQ1) | 99.1% | 97.8% |
| Interquartile 75% (IQ3) | 100.0% | 99.1% |
| Interquartile Range (IQR) | 0.89% | 1.4% |
| Standard Deviation (Sample) | 0.46% | 0.83% |
| Standard Deviation (Population) | 0.46% | 0.80% |
Similar Demographics by 3rd Grade
Demographics Similar to Welsh by 3rd Grade
In terms of 3rd grade, the demographic groups most similar to Welsh are Inupiat (98.8%, a difference of 0.030%), Tsimshian (98.8%, a difference of 0.040%), Alaskan Athabascan (98.7%, a difference of 0.13%), Norwegian (98.6%, a difference of 0.17%), and Slovak (98.6%, a difference of 0.19%).
| Demographics | Rating | Rank | 3rd Grade |
| Crow | 100.0 /100 | #1 | Exceptional 99.6% |
| Yup'ik | 100.0 /100 | #2 | Exceptional 99.0% |
| Welsh | 100.0 /100 | #3 | Exceptional 98.8% |
| Inupiat | 100.0 /100 | #4 | Exceptional 98.8% |
| Tsimshian | 100.0 /100 | #5 | Exceptional 98.8% |
| Alaskan Athabascans | 100.0 /100 | #6 | Exceptional 98.7% |
| Norwegians | 100.0 /100 | #7 | Exceptional 98.6% |
| Slovaks | 100.0 /100 | #8 | Exceptional 98.6% |
| Germans | 100.0 /100 | #9 | Exceptional 98.6% |
| Alaska Natives | 100.0 /100 | #10 | Exceptional 98.6% |
| Slovenes | 100.0 /100 | #11 | Exceptional 98.6% |
| English | 100.0 /100 | #12 | Exceptional 98.6% |
| Tlingit-Haida | 100.0 /100 | #13 | Exceptional 98.5% |
| Carpatho Rusyns | 100.0 /100 | #14 | Exceptional 98.5% |
| Swedes | 100.0 /100 | #15 | Exceptional 98.5% |
Demographics Similar to Marshallese by 3rd Grade
In terms of 3rd grade, the demographic groups most similar to Marshallese are Immigrants from Jordan (97.8%, a difference of 0.0%), Immigrants from Bosnia and Herzegovina (97.8%, a difference of 0.0%), Ugandan (97.8%, a difference of 0.0%), Immigrants from Italy (97.8%, a difference of 0.010%), and Venezuelan (97.8%, a difference of 0.010%).
| Demographics | Rating | Rank | 3rd Grade |
| Immigrants | Russia | 61.7 /100 | #156 | Good 97.8% |
| Immigrants | Italy | 61.2 /100 | #157 | Good 97.8% |
| Venezuelans | 60.9 /100 | #158 | Good 97.8% |
| French American Indians | 60.0 /100 | #159 | Average 97.8% |
| Immigrants | Iran | 59.1 /100 | #160 | Average 97.8% |
| Albanians | 58.8 /100 | #161 | Average 97.8% |
| Immigrants | Jordan | 57.9 /100 | #162 | Average 97.8% |
| Marshallese | 57.2 /100 | #163 | Average 97.8% |
| Immigrants | Bosnia and Herzegovina | 56.2 /100 | #164 | Average 97.8% |
| Ugandans | 56.1 /100 | #165 | Average 97.8% |
| Dutch West Indians | 55.5 /100 | #166 | Average 97.8% |
| Chileans | 55.3 /100 | #167 | Average 97.8% |
| Immigrants | Spain | 54.3 /100 | #168 | Average 97.8% |
| Comanche | 53.8 /100 | #169 | Average 97.8% |
| Brazilians | 53.7 /100 | #170 | Average 97.8% |