Vietnamese vs Immigrants from Canada Male Unemployment
COMPARE
Vietnamese
Immigrants from Canada
Male Unemployment
Male Unemployment Comparison
Vietnamese
Immigrants from Canada
6.6%
MALE UNEMPLOYMENT
0.0/ 100
METRIC RATING
300th/ 347
METRIC RANK
5.0%
MALE UNEMPLOYMENT
97.5/ 100
METRIC RATING
67th/ 347
METRIC RANK
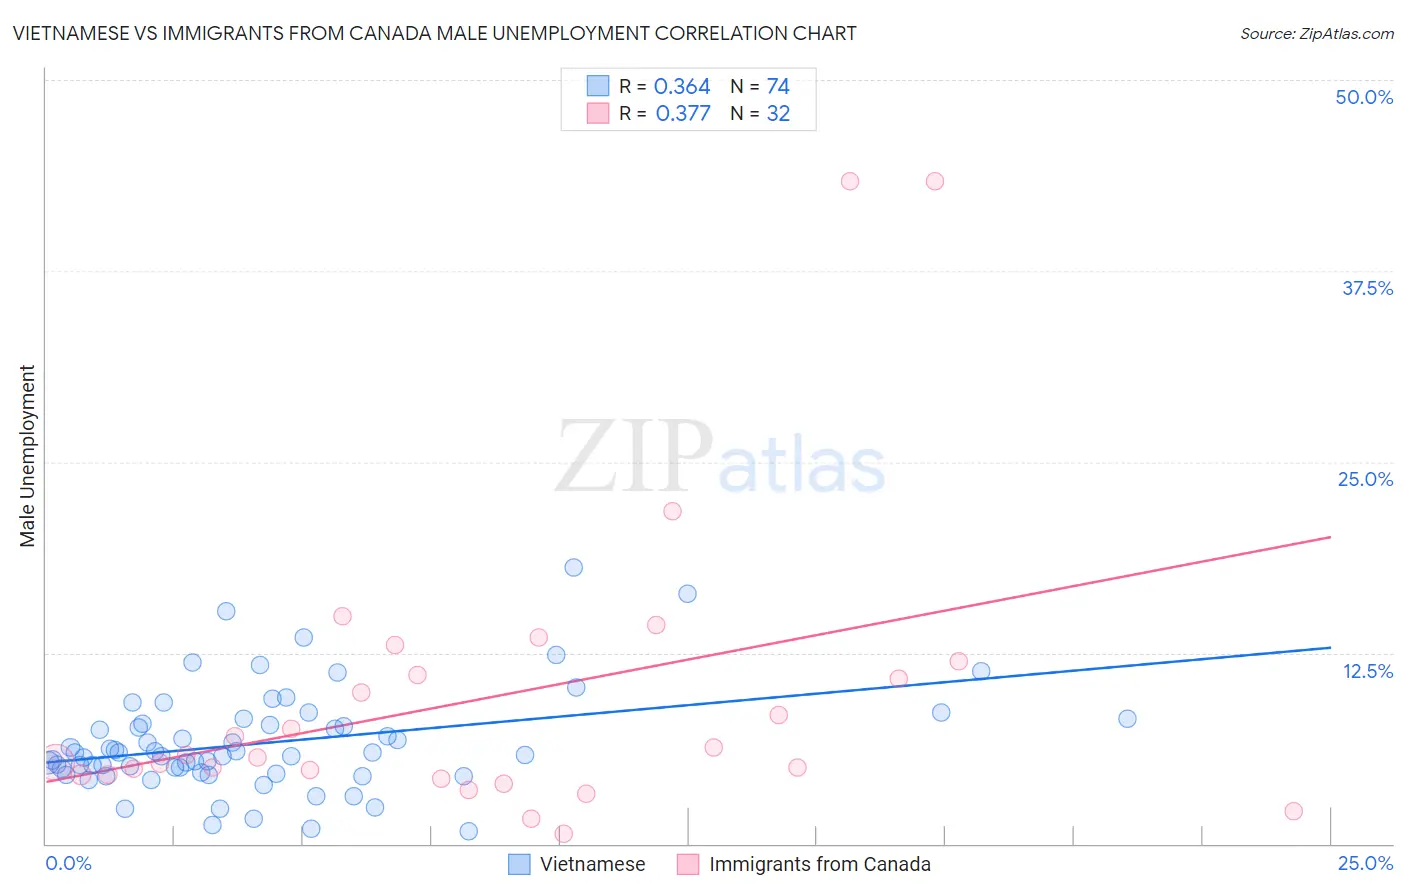
Vietnamese vs Immigrants from Canada Male Unemployment Correlation Chart
The statistical analysis conducted on geographies consisting of 170,612,254 people shows a mild positive correlation between the proportion of Vietnamese and unemployment rate among males in the United States with a correlation coefficient (R) of 0.364 and weighted average of 6.6%. Similarly, the statistical analysis conducted on geographies consisting of 456,364,159 people shows a mild positive correlation between the proportion of Immigrants from Canada and unemployment rate among males in the United States with a correlation coefficient (R) of 0.377 and weighted average of 5.0%, a difference of 31.3%.
Male Unemployment Correlation Summary
| Measurement | Vietnamese | Immigrants from Canada |
| Minimum | 0.80% | 0.66% |
| Maximum | 18.1% | 43.4% |
| Range | 17.3% | 42.7% |
| Mean | 6.6% | 9.6% |
| Median | 5.9% | 5.8% |
| Interquartile 25% (IQ1) | 4.7% | 4.5% |
| Interquartile 75% (IQ3) | 7.8% | 11.5% |
| Interquartile Range (IQR) | 3.1% | 7.0% |
| Standard Deviation (Sample) | 3.4% | 10.0% |
| Standard Deviation (Population) | 3.3% | 9.8% |
Similar Demographics by Male Unemployment
Demographics Similar to Vietnamese by Male Unemployment
In terms of male unemployment, the demographic groups most similar to Vietnamese are Immigrants from Belize (6.6%, a difference of 0.11%), Immigrants from Bangladesh (6.6%, a difference of 0.27%), Jamaican (6.6%, a difference of 0.40%), Chippewa (6.6%, a difference of 0.48%), and Immigrants from Haiti (6.5%, a difference of 0.80%).
| Demographics | Rating | Rank | Male Unemployment |
| Haitians | 0.0 /100 | #293 | Tragic 6.4% |
| Senegalese | 0.0 /100 | #294 | Tragic 6.4% |
| Belizeans | 0.0 /100 | #295 | Tragic 6.5% |
| Immigrants | Haiti | 0.0 /100 | #296 | Tragic 6.5% |
| Chippewa | 0.0 /100 | #297 | Tragic 6.6% |
| Jamaicans | 0.0 /100 | #298 | Tragic 6.6% |
| Immigrants | Bangladesh | 0.0 /100 | #299 | Tragic 6.6% |
| Vietnamese | 0.0 /100 | #300 | Tragic 6.6% |
| Immigrants | Belize | 0.0 /100 | #301 | Tragic 6.6% |
| Ute | 0.0 /100 | #302 | Tragic 6.6% |
| Immigrants | West Indies | 0.0 /100 | #303 | Tragic 6.7% |
| West Indians | 0.0 /100 | #304 | Tragic 6.7% |
| Trinidadians and Tobagonians | 0.0 /100 | #305 | Tragic 6.7% |
| Immigrants | Trinidad and Tobago | 0.0 /100 | #306 | Tragic 6.7% |
| Immigrants | Jamaica | 0.0 /100 | #307 | Tragic 6.7% |
Demographics Similar to Immigrants from Canada by Male Unemployment
In terms of male unemployment, the demographic groups most similar to Immigrants from Canada are Australian (5.0%, a difference of 0.010%), Finnish (5.0%, a difference of 0.020%), Immigrants from Sweden (5.0%, a difference of 0.040%), White/Caucasian (5.0%, a difference of 0.090%), and Icelander (5.0%, a difference of 0.11%).
| Demographics | Rating | Rank | Male Unemployment |
| Immigrants | Argentina | 98.1 /100 | #60 | Exceptional 5.0% |
| Cambodians | 98.1 /100 | #61 | Exceptional 5.0% |
| Basques | 97.9 /100 | #62 | Exceptional 5.0% |
| Eastern Europeans | 97.9 /100 | #63 | Exceptional 5.0% |
| Celtics | 97.8 /100 | #64 | Exceptional 5.0% |
| Icelanders | 97.6 /100 | #65 | Exceptional 5.0% |
| Finns | 97.5 /100 | #66 | Exceptional 5.0% |
| Immigrants | Canada | 97.5 /100 | #67 | Exceptional 5.0% |
| Australians | 97.4 /100 | #68 | Exceptional 5.0% |
| Immigrants | Sweden | 97.4 /100 | #69 | Exceptional 5.0% |
| Whites/Caucasians | 97.3 /100 | #70 | Exceptional 5.0% |
| New Zealanders | 97.3 /100 | #71 | Exceptional 5.0% |
| Immigrants | South Africa | 97.1 /100 | #72 | Exceptional 5.0% |
| Greeks | 97.0 /100 | #73 | Exceptional 5.0% |
| Immigrants | North America | 96.9 /100 | #74 | Exceptional 5.0% |