Vietnamese vs Immigrants from Korea Male Unemployment
COMPARE
Vietnamese
Immigrants from Korea
Male Unemployment
Male Unemployment Comparison
Vietnamese
Immigrants from Korea
6.6%
MALE UNEMPLOYMENT
0.0/ 100
METRIC RATING
300th/ 347
METRIC RANK
4.9%
MALE UNEMPLOYMENT
99.1/ 100
METRIC RATING
44th/ 347
METRIC RANK
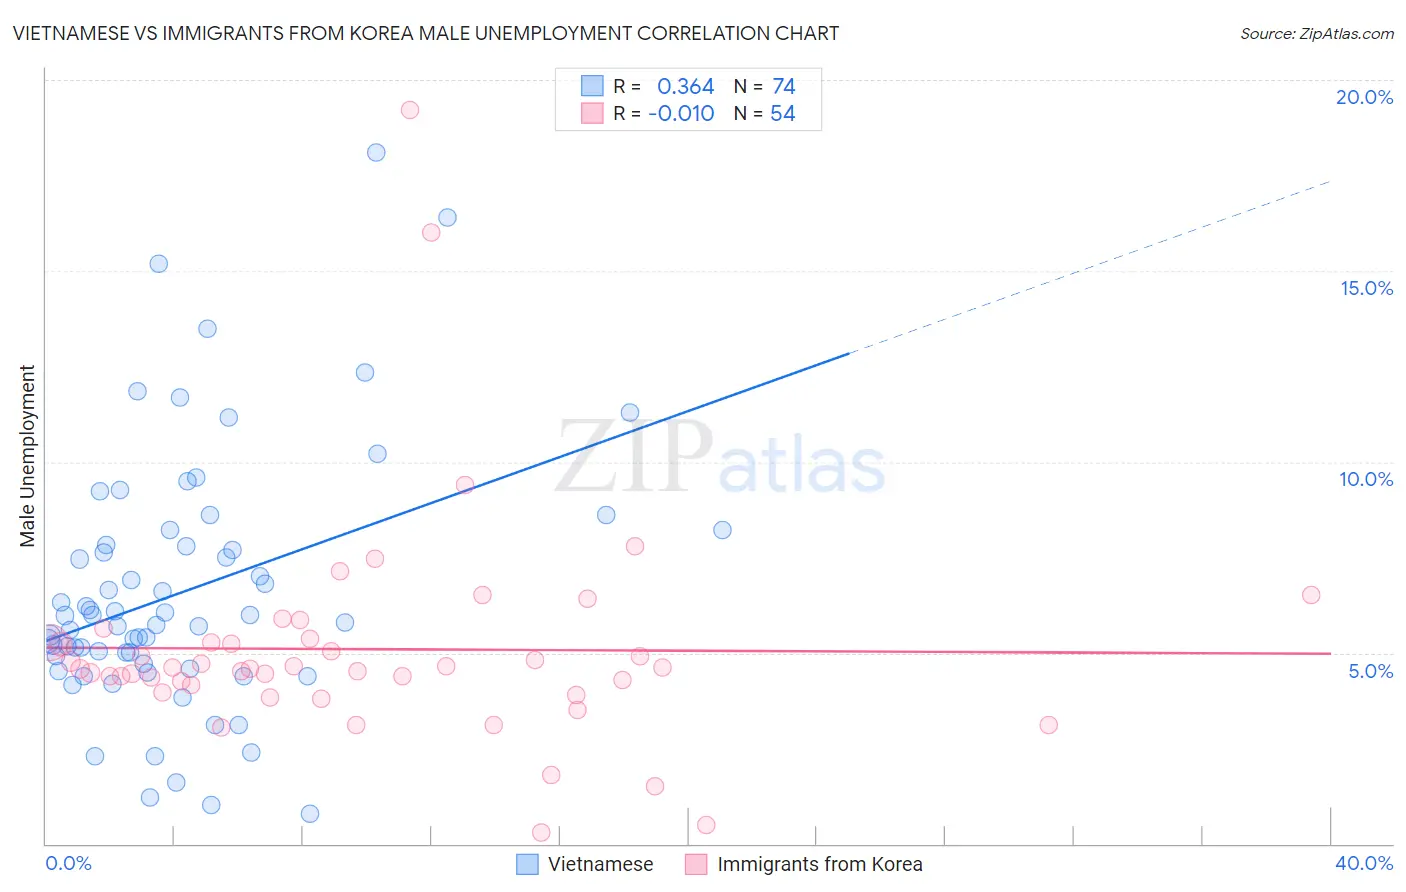
Vietnamese vs Immigrants from Korea Male Unemployment Correlation Chart
The statistical analysis conducted on geographies consisting of 170,612,254 people shows a mild positive correlation between the proportion of Vietnamese and unemployment rate among males in the United States with a correlation coefficient (R) of 0.364 and weighted average of 6.6%. Similarly, the statistical analysis conducted on geographies consisting of 414,464,791 people shows no correlation between the proportion of Immigrants from Korea and unemployment rate among males in the United States with a correlation coefficient (R) of -0.010 and weighted average of 4.9%, a difference of 33.5%.
Male Unemployment Correlation Summary
| Measurement | Vietnamese | Immigrants from Korea |
| Minimum | 0.80% | 0.30% |
| Maximum | 18.1% | 19.2% |
| Range | 17.3% | 18.9% |
| Mean | 6.6% | 5.1% |
| Median | 5.9% | 4.6% |
| Interquartile 25% (IQ1) | 4.7% | 4.2% |
| Interquartile 75% (IQ3) | 7.8% | 5.3% |
| Interquartile Range (IQR) | 3.1% | 1.1% |
| Standard Deviation (Sample) | 3.4% | 3.0% |
| Standard Deviation (Population) | 3.3% | 2.9% |
Similar Demographics by Male Unemployment
Demographics Similar to Vietnamese by Male Unemployment
In terms of male unemployment, the demographic groups most similar to Vietnamese are Immigrants from Belize (6.6%, a difference of 0.11%), Immigrants from Bangladesh (6.6%, a difference of 0.27%), Jamaican (6.6%, a difference of 0.40%), Chippewa (6.6%, a difference of 0.48%), and Immigrants from Haiti (6.5%, a difference of 0.80%).
| Demographics | Rating | Rank | Male Unemployment |
| Haitians | 0.0 /100 | #293 | Tragic 6.4% |
| Senegalese | 0.0 /100 | #294 | Tragic 6.4% |
| Belizeans | 0.0 /100 | #295 | Tragic 6.5% |
| Immigrants | Haiti | 0.0 /100 | #296 | Tragic 6.5% |
| Chippewa | 0.0 /100 | #297 | Tragic 6.6% |
| Jamaicans | 0.0 /100 | #298 | Tragic 6.6% |
| Immigrants | Bangladesh | 0.0 /100 | #299 | Tragic 6.6% |
| Vietnamese | 0.0 /100 | #300 | Tragic 6.6% |
| Immigrants | Belize | 0.0 /100 | #301 | Tragic 6.6% |
| Ute | 0.0 /100 | #302 | Tragic 6.6% |
| Immigrants | West Indies | 0.0 /100 | #303 | Tragic 6.7% |
| West Indians | 0.0 /100 | #304 | Tragic 6.7% |
| Trinidadians and Tobagonians | 0.0 /100 | #305 | Tragic 6.7% |
| Immigrants | Trinidad and Tobago | 0.0 /100 | #306 | Tragic 6.7% |
| Immigrants | Jamaica | 0.0 /100 | #307 | Tragic 6.7% |
Demographics Similar to Immigrants from Korea by Male Unemployment
In terms of male unemployment, the demographic groups most similar to Immigrants from Korea are Immigrants from Zimbabwe (4.9%, a difference of 0.15%), Immigrants from Japan (4.9%, a difference of 0.18%), Bhutanese (4.9%, a difference of 0.24%), Immigrants from Belgium (4.9%, a difference of 0.29%), and Chinese (4.9%, a difference of 0.31%).
| Demographics | Rating | Rank | Male Unemployment |
| Scotch-Irish | 99.4 /100 | #37 | Exceptional 4.9% |
| Immigrants | Bosnia and Herzegovina | 99.4 /100 | #38 | Exceptional 4.9% |
| Burmese | 99.3 /100 | #39 | Exceptional 4.9% |
| Northern Europeans | 99.3 /100 | #40 | Exceptional 4.9% |
| Chinese | 99.3 /100 | #41 | Exceptional 4.9% |
| Immigrants | Belgium | 99.2 /100 | #42 | Exceptional 4.9% |
| Immigrants | Japan | 99.2 /100 | #43 | Exceptional 4.9% |
| Immigrants | Korea | 99.1 /100 | #44 | Exceptional 4.9% |
| Immigrants | Zimbabwe | 99.0 /100 | #45 | Exceptional 4.9% |
| Bhutanese | 98.9 /100 | #46 | Exceptional 4.9% |
| Austrians | 98.9 /100 | #47 | Exceptional 4.9% |
| Immigrants | Scotland | 98.9 /100 | #48 | Exceptional 4.9% |
| Poles | 98.9 /100 | #49 | Exceptional 4.9% |
| Croatians | 98.9 /100 | #50 | Exceptional 4.9% |
| Slovenes | 98.8 /100 | #51 | Exceptional 5.0% |