Immigrants from Nepal vs Arapaho Male Unemployment
COMPARE
Immigrants from Nepal
Arapaho
Male Unemployment
Male Unemployment Comparison
Immigrants from Nepal
Arapaho
4.8%
MALE UNEMPLOYMENT
99.8/ 100
METRIC RATING
32nd/ 347
METRIC RANK
11.0%
MALE UNEMPLOYMENT
0.0/ 100
METRIC RATING
345th/ 347
METRIC RANK
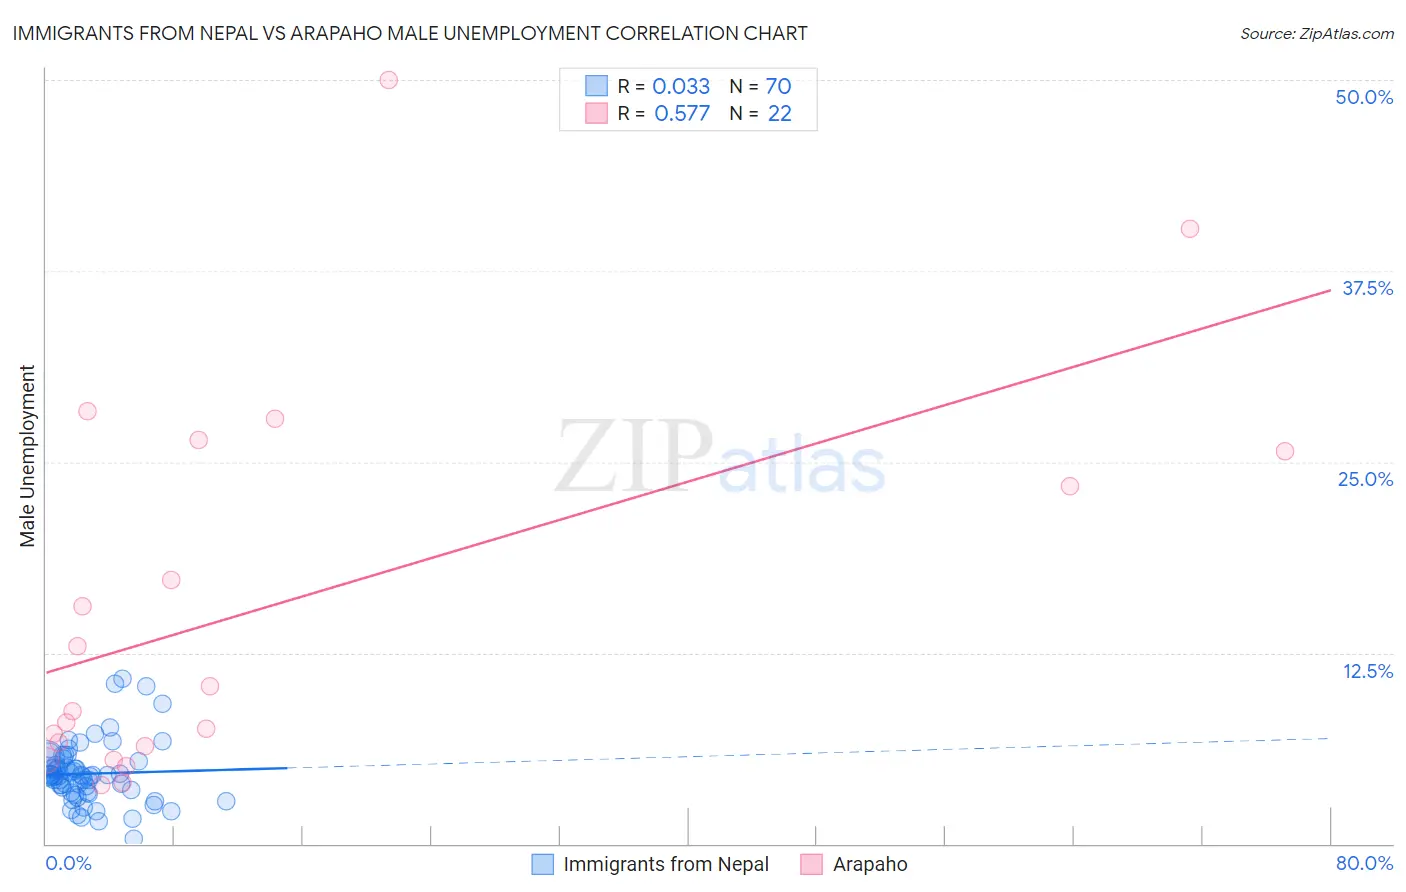
Immigrants from Nepal vs Arapaho Male Unemployment Correlation Chart
The statistical analysis conducted on geographies consisting of 186,501,953 people shows no correlation between the proportion of Immigrants from Nepal and unemployment rate among males in the United States with a correlation coefficient (R) of 0.033 and weighted average of 4.8%. Similarly, the statistical analysis conducted on geographies consisting of 29,745,830 people shows a substantial positive correlation between the proportion of Arapaho and unemployment rate among males in the United States with a correlation coefficient (R) of 0.577 and weighted average of 11.0%, a difference of 127.7%.
Male Unemployment Correlation Summary
| Measurement | Immigrants from Nepal | Arapaho |
| Minimum | 0.30% | 3.9% |
| Maximum | 10.8% | 50.0% |
| Range | 10.5% | 46.1% |
| Mean | 4.6% | 15.7% |
| Median | 4.5% | 9.5% |
| Interquartile 25% (IQ1) | 3.4% | 6.4% |
| Interquartile 75% (IQ3) | 5.4% | 25.7% |
| Interquartile Range (IQR) | 2.0% | 19.3% |
| Standard Deviation (Sample) | 2.0% | 12.8% |
| Standard Deviation (Population) | 2.0% | 12.5% |
Similar Demographics by Male Unemployment
Demographics Similar to Immigrants from Nepal by Male Unemployment
In terms of male unemployment, the demographic groups most similar to Immigrants from Nepal are Sudanese (4.8%, a difference of 0.010%), British (4.8%, a difference of 0.26%), Latvian (4.8%, a difference of 0.30%), Welsh (4.8%, a difference of 0.38%), and Scottish (4.8%, a difference of 0.57%).
| Demographics | Rating | Rank | Male Unemployment |
| Zimbabweans | 99.9 /100 | #25 | Exceptional 4.8% |
| Dutch | 99.9 /100 | #26 | Exceptional 4.8% |
| Belgians | 99.9 /100 | #27 | Exceptional 4.8% |
| Bulgarians | 99.8 /100 | #28 | Exceptional 4.8% |
| Scottish | 99.8 /100 | #29 | Exceptional 4.8% |
| British | 99.8 /100 | #30 | Exceptional 4.8% |
| Sudanese | 99.8 /100 | #31 | Exceptional 4.8% |
| Immigrants | Nepal | 99.8 /100 | #32 | Exceptional 4.8% |
| Latvians | 99.7 /100 | #33 | Exceptional 4.8% |
| Welsh | 99.7 /100 | #34 | Exceptional 4.8% |
| Paraguayans | 99.5 /100 | #35 | Exceptional 4.9% |
| Immigrants | Singapore | 99.4 /100 | #36 | Exceptional 4.9% |
| Scotch-Irish | 99.4 /100 | #37 | Exceptional 4.9% |
| Immigrants | Bosnia and Herzegovina | 99.4 /100 | #38 | Exceptional 4.9% |
| Burmese | 99.3 /100 | #39 | Exceptional 4.9% |
Demographics Similar to Arapaho by Male Unemployment
In terms of male unemployment, the demographic groups most similar to Arapaho are Hopi (10.8%, a difference of 2.0%), Crow (10.6%, a difference of 3.7%), Tohono O'odham (10.2%, a difference of 8.2%), Inupiat (12.1%, a difference of 9.8%), and Navajo (9.8%, a difference of 11.9%).
| Demographics | Rating | Rank | Male Unemployment |
| Sioux | 0.0 /100 | #333 | Tragic 8.4% |
| Tsimshian | 0.0 /100 | #334 | Tragic 8.5% |
| Pueblo | 0.0 /100 | #335 | Tragic 8.5% |
| Yuman | 0.0 /100 | #336 | Tragic 8.6% |
| Puerto Ricans | 0.0 /100 | #337 | Tragic 8.6% |
| Apache | 0.0 /100 | #338 | Tragic 8.6% |
| Cheyenne | 0.0 /100 | #339 | Tragic 9.8% |
| Alaskan Athabascans | 0.0 /100 | #340 | Tragic 9.8% |
| Navajo | 0.0 /100 | #341 | Tragic 9.8% |
| Tohono O'odham | 0.0 /100 | #342 | Tragic 10.2% |
| Crow | 0.0 /100 | #343 | Tragic 10.6% |
| Hopi | 0.0 /100 | #344 | Tragic 10.8% |
| Arapaho | 0.0 /100 | #345 | Tragic 11.0% |
| Inupiat | 0.0 /100 | #346 | Tragic 12.1% |
| Yup'ik | 0.0 /100 | #347 | Tragic 16.4% |