Ute vs Arapaho Unemployment Among Ages 30 to 34 years
COMPARE
Ute
Arapaho
Unemployment Among Ages 30 to 34 years
Unemployment Among Ages 30 to 34 years Comparison
Ute
Arapaho
7.0%
UNEMPLOYMENT AMONG AGES 30 TO 34 YEARS
0.0/ 100
METRIC RATING
313th/ 347
METRIC RANK
12.8%
UNEMPLOYMENT AMONG AGES 30 TO 34 YEARS
0.0/ 100
METRIC RATING
345th/ 347
METRIC RANK
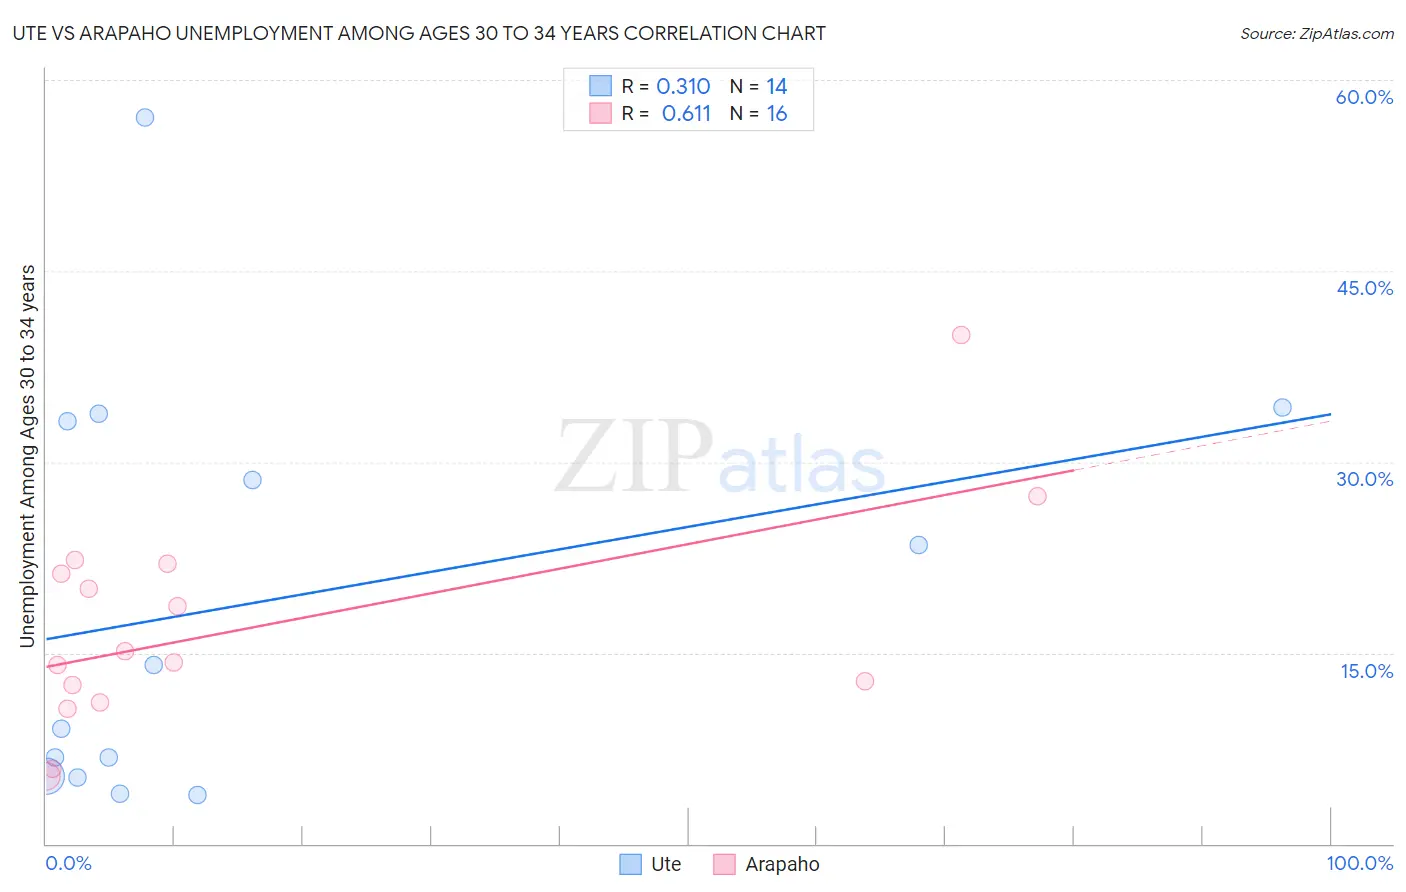
Ute vs Arapaho Unemployment Among Ages 30 to 34 years Correlation Chart
The statistical analysis conducted on geographies consisting of 54,847,910 people shows a mild positive correlation between the proportion of Ute and unemployment rate among population between the ages 30 and 34 in the United States with a correlation coefficient (R) of 0.310 and weighted average of 7.0%. Similarly, the statistical analysis conducted on geographies consisting of 29,209,448 people shows a significant positive correlation between the proportion of Arapaho and unemployment rate among population between the ages 30 and 34 in the United States with a correlation coefficient (R) of 0.611 and weighted average of 12.8%, a difference of 82.1%.
Unemployment Among Ages 30 to 34 years Correlation Summary
| Measurement | Ute | Arapaho |
| Minimum | 3.8% | 5.3% |
| Maximum | 57.1% | 40.0% |
| Range | 53.3% | 34.7% |
| Mean | 19.0% | 17.1% |
| Median | 11.5% | 14.6% |
| Interquartile 25% (IQ1) | 5.3% | 11.8% |
| Interquartile 75% (IQ3) | 33.2% | 21.6% |
| Interquartile Range (IQR) | 27.9% | 9.8% |
| Standard Deviation (Sample) | 16.4% | 8.6% |
| Standard Deviation (Population) | 15.8% | 8.3% |
Similar Demographics by Unemployment Among Ages 30 to 34 years
Demographics Similar to Ute by Unemployment Among Ages 30 to 34 years
In terms of unemployment among ages 30 to 34 years, the demographic groups most similar to Ute are British West Indian (7.0%, a difference of 0.040%), Alaskan Athabascan (7.0%, a difference of 0.12%), Lumbee (7.1%, a difference of 0.21%), Aleut (7.1%, a difference of 0.58%), and Immigrants from St. Vincent and the Grenadines (7.0%, a difference of 1.2%).
| Demographics | Rating | Rank | Unemployment Among Ages 30 to 34 years |
| Immigrants | Armenia | 0.0 /100 | #306 | Tragic 6.8% |
| Immigrants | Belize | 0.0 /100 | #307 | Tragic 6.9% |
| Immigrants | Azores | 0.0 /100 | #308 | Tragic 6.9% |
| Immigrants | Grenada | 0.0 /100 | #309 | Tragic 6.9% |
| Immigrants | St. Vincent and the Grenadines | 0.0 /100 | #310 | Tragic 7.0% |
| Alaskan Athabascans | 0.0 /100 | #311 | Tragic 7.0% |
| British West Indians | 0.0 /100 | #312 | Tragic 7.0% |
| Ute | 0.0 /100 | #313 | Tragic 7.0% |
| Lumbee | 0.0 /100 | #314 | Tragic 7.1% |
| Aleuts | 0.0 /100 | #315 | Tragic 7.1% |
| Houma | 0.0 /100 | #316 | Tragic 7.2% |
| Immigrants | Cabo Verde | 0.0 /100 | #317 | Tragic 7.2% |
| Blacks/African Americans | 0.0 /100 | #318 | Tragic 7.2% |
| Guyanese | 0.0 /100 | #319 | Tragic 7.2% |
| Cape Verdeans | 0.0 /100 | #320 | Tragic 7.2% |
Demographics Similar to Arapaho by Unemployment Among Ages 30 to 34 years
In terms of unemployment among ages 30 to 34 years, the demographic groups most similar to Arapaho are Tsimshian (13.8%, a difference of 7.4%), Hopi (11.9%, a difference of 7.4%), Inupiat (10.8%, a difference of 18.5%), Yuman (10.6%, a difference of 21.0%), and Navajo (10.6%, a difference of 21.5%).
| Demographics | Rating | Rank | Unemployment Among Ages 30 to 34 years |
| Pueblo | 0.0 /100 | #333 | Tragic 8.3% |
| Alaska Natives | 0.0 /100 | #334 | Tragic 8.5% |
| Puerto Ricans | 0.0 /100 | #335 | Tragic 8.9% |
| Colville | 0.0 /100 | #336 | Tragic 9.0% |
| Pima | 0.0 /100 | #337 | Tragic 9.6% |
| Yakama | 0.0 /100 | #338 | Tragic 9.8% |
| Tohono O'odham | 0.0 /100 | #339 | Tragic 9.8% |
| Crow | 0.0 /100 | #340 | Tragic 10.3% |
| Navajo | 0.0 /100 | #341 | Tragic 10.6% |
| Yuman | 0.0 /100 | #342 | Tragic 10.6% |
| Inupiat | 0.0 /100 | #343 | Tragic 10.8% |
| Hopi | 0.0 /100 | #344 | Tragic 11.9% |
| Arapaho | 0.0 /100 | #345 | Tragic 12.8% |
| Tsimshian | 0.0 /100 | #346 | Tragic 13.8% |
| Yup'ik | 0.0 /100 | #347 | Tragic 18.5% |