U.S. Virgin Islander vs Immigrants Unemployment Among Women with Children Ages 6 to 17 years
COMPARE
U.S. Virgin Islander
Immigrants
Unemployment Among Women with Children Ages 6 to 17 years
Unemployment Among Women with Children Ages 6 to 17 years Comparison
U.S. Virgin Islanders
Immigrants
9.7%
UNEMPLOYMENT AMONG WOMEN WITH CHILDREN AGES 6 TO 17 YEARS
0.1/ 100
METRIC RATING
275th/ 347
METRIC RANK
9.1%
UNEMPLOYMENT AMONG WOMEN WITH CHILDREN AGES 6 TO 17 YEARS
29.2/ 100
METRIC RATING
189th/ 347
METRIC RANK
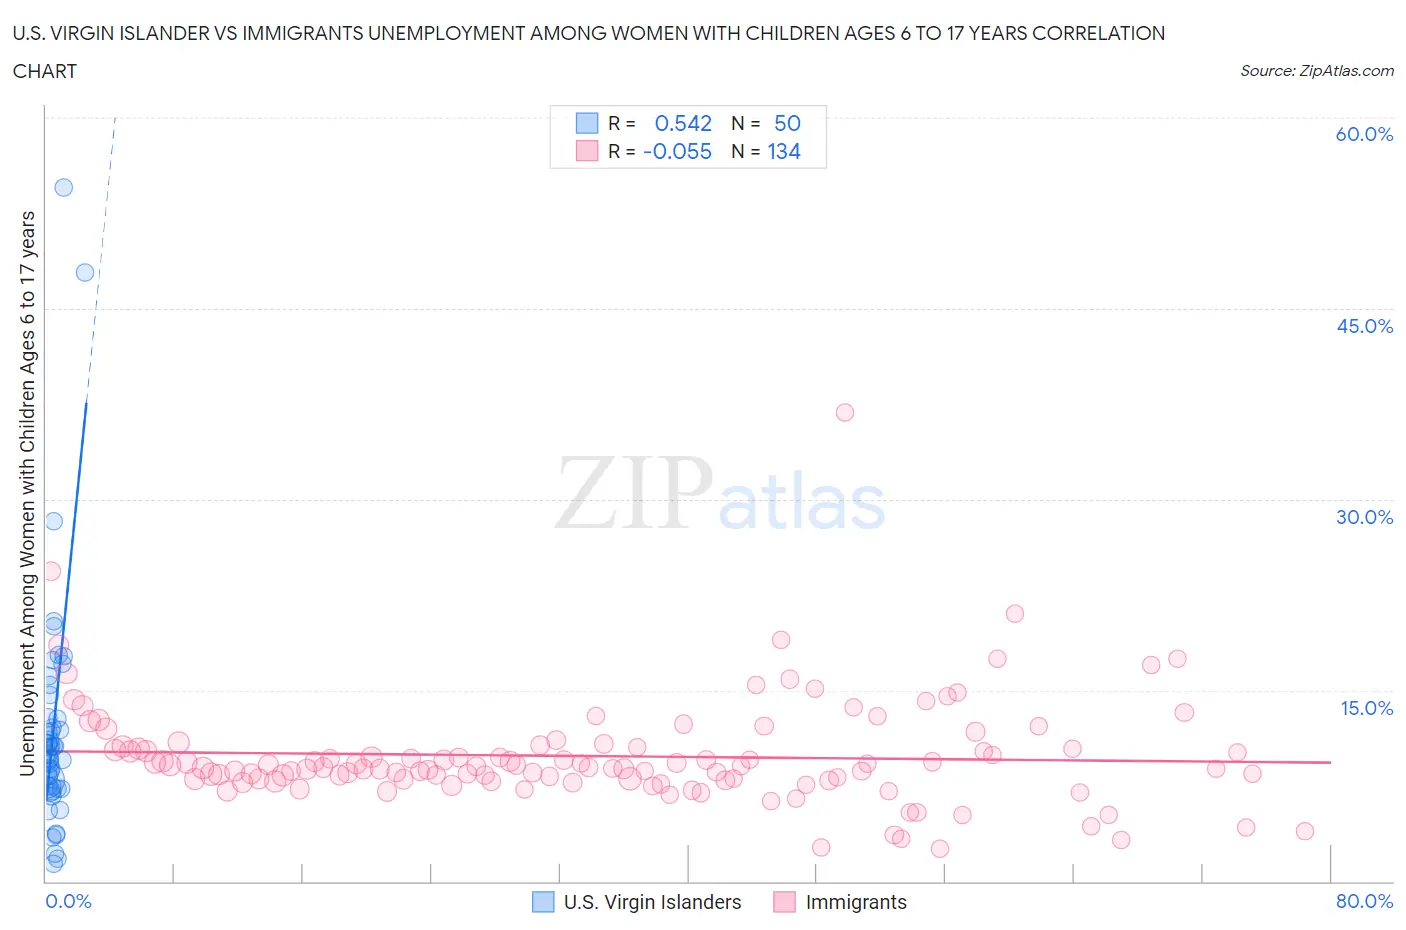
U.S. Virgin Islander vs Immigrants Unemployment Among Women with Children Ages 6 to 17 years Correlation Chart
The statistical analysis conducted on geographies consisting of 79,674,209 people shows a substantial positive correlation between the proportion of U.S. Virgin Islanders and unemployment rate among women with children between the ages 6 and 17 in the United States with a correlation coefficient (R) of 0.542 and weighted average of 9.7%. Similarly, the statistical analysis conducted on geographies consisting of 360,845,449 people shows a slight negative correlation between the proportion of Immigrants and unemployment rate among women with children between the ages 6 and 17 in the United States with a correlation coefficient (R) of -0.055 and weighted average of 9.1%, a difference of 7.0%.
Unemployment Among Women with Children Ages 6 to 17 years Correlation Summary
| Measurement | U.S. Virgin Islander | Immigrants |
| Minimum | 1.4% | 2.6% |
| Maximum | 54.5% | 36.8% |
| Range | 53.1% | 34.3% |
| Mean | 12.1% | 9.8% |
| Median | 10.2% | 8.9% |
| Interquartile 25% (IQ1) | 7.3% | 8.0% |
| Interquartile 75% (IQ3) | 12.8% | 10.5% |
| Interquartile Range (IQR) | 5.5% | 2.5% |
| Standard Deviation (Sample) | 9.6% | 4.2% |
| Standard Deviation (Population) | 9.5% | 4.2% |
Similar Demographics by Unemployment Among Women with Children Ages 6 to 17 years
Demographics Similar to U.S. Virgin Islanders by Unemployment Among Women with Children Ages 6 to 17 years
In terms of unemployment among women with children ages 6 to 17 years, the demographic groups most similar to U.S. Virgin Islanders are Immigrants from Portugal (9.7%, a difference of 0.010%), British West Indian (9.7%, a difference of 0.060%), French (9.7%, a difference of 0.13%), Scotch-Irish (9.7%, a difference of 0.17%), and Seminole (9.7%, a difference of 0.36%).
| Demographics | Rating | Rank | Unemployment Among Women with Children Ages 6 to 17 years |
| Ghanaians | 0.2 /100 | #268 | Tragic 9.6% |
| Blackfeet | 0.2 /100 | #269 | Tragic 9.6% |
| Immigrants | Nicaragua | 0.2 /100 | #270 | Tragic 9.6% |
| Immigrants | Latin America | 0.1 /100 | #271 | Tragic 9.6% |
| Kiowa | 0.1 /100 | #272 | Tragic 9.6% |
| Whites/Caucasians | 0.1 /100 | #273 | Tragic 9.6% |
| Aleuts | 0.1 /100 | #274 | Tragic 9.6% |
| U.S. Virgin Islanders | 0.1 /100 | #275 | Tragic 9.7% |
| Immigrants | Portugal | 0.1 /100 | #276 | Tragic 9.7% |
| British West Indians | 0.1 /100 | #277 | Tragic 9.7% |
| French | 0.1 /100 | #278 | Tragic 9.7% |
| Scotch-Irish | 0.1 /100 | #279 | Tragic 9.7% |
| Seminole | 0.1 /100 | #280 | Tragic 9.7% |
| Jamaicans | 0.0 /100 | #281 | Tragic 9.8% |
| Slovaks | 0.0 /100 | #282 | Tragic 9.8% |
Demographics Similar to Immigrants by Unemployment Among Women with Children Ages 6 to 17 years
In terms of unemployment among women with children ages 6 to 17 years, the demographic groups most similar to Immigrants are Immigrants from Syria (9.1%, a difference of 0.030%), Slovene (9.1%, a difference of 0.040%), Belizean (9.1%, a difference of 0.040%), Comanche (9.0%, a difference of 0.050%), and Guamanian/Chamorro (9.1%, a difference of 0.11%).
| Demographics | Rating | Rank | Unemployment Among Women with Children Ages 6 to 17 years |
| South American Indians | 34.4 /100 | #182 | Fair 9.0% |
| Swiss | 33.5 /100 | #183 | Fair 9.0% |
| Palestinians | 33.4 /100 | #184 | Fair 9.0% |
| Immigrants | Congo | 32.5 /100 | #185 | Fair 9.0% |
| Immigrants | Spain | 32.4 /100 | #186 | Fair 9.0% |
| Comanche | 30.0 /100 | #187 | Fair 9.0% |
| Immigrants | Syria | 29.7 /100 | #188 | Fair 9.1% |
| Immigrants | Immigrants | 29.2 /100 | #189 | Fair 9.1% |
| Slovenes | 28.5 /100 | #190 | Fair 9.1% |
| Belizeans | 28.4 /100 | #191 | Fair 9.1% |
| Guamanians/Chamorros | 27.2 /100 | #192 | Fair 9.1% |
| Immigrants | Turkey | 25.8 /100 | #193 | Fair 9.1% |
| Immigrants | Kazakhstan | 25.3 /100 | #194 | Fair 9.1% |
| Austrians | 25.0 /100 | #195 | Fair 9.1% |
| Brazilians | 24.4 /100 | #196 | Fair 9.1% |