U.S. Virgin Islander vs Armenian Kindergarten
COMPARE
U.S. Virgin Islander
Armenian
Kindergarten
Kindergarten Comparison
U.S. Virgin Islanders
Armenians
97.6%
KINDERGARTEN
1.7/ 100
METRIC RATING
239th/ 347
METRIC RANK
97.6%
KINDERGARTEN
0.5/ 100
METRIC RATING
259th/ 347
METRIC RANK
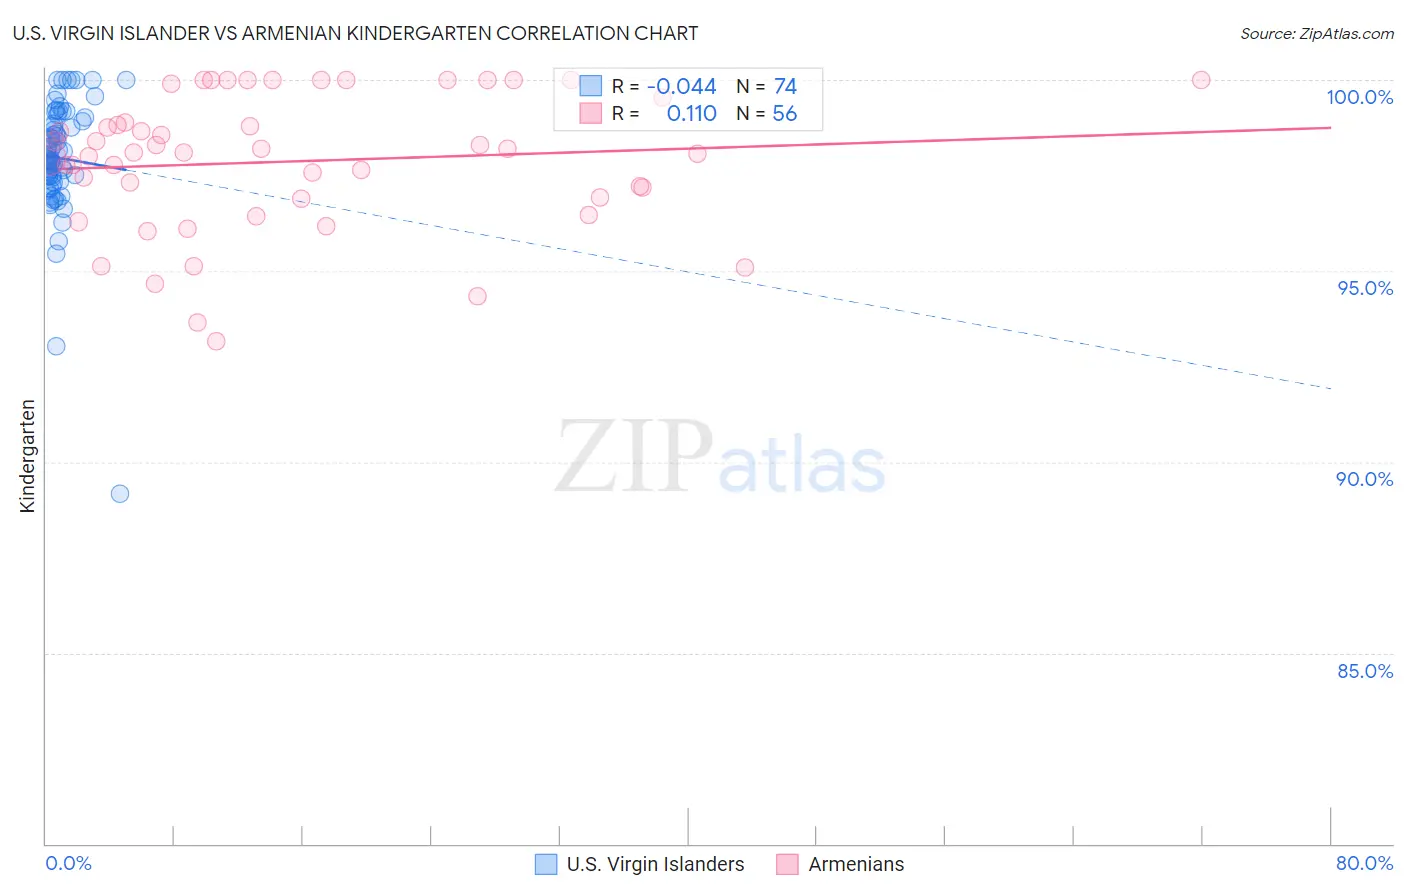
U.S. Virgin Islander vs Armenian Kindergarten Correlation Chart
The statistical analysis conducted on geographies consisting of 87,529,315 people shows no correlation between the proportion of U.S. Virgin Islanders and percentage of population with at least kindergarten education in the United States with a correlation coefficient (R) of -0.044 and weighted average of 97.6%. Similarly, the statistical analysis conducted on geographies consisting of 310,954,660 people shows a poor positive correlation between the proportion of Armenians and percentage of population with at least kindergarten education in the United States with a correlation coefficient (R) of 0.110 and weighted average of 97.6%, a difference of 0.10%.
Kindergarten Correlation Summary
| Measurement | U.S. Virgin Islander | Armenian |
| Minimum | 89.2% | 93.2% |
| Maximum | 100.0% | 100.0% |
| Range | 10.8% | 6.8% |
| Mean | 98.0% | 97.9% |
| Median | 98.0% | 98.1% |
| Interquartile 25% (IQ1) | 97.5% | 96.9% |
| Interquartile 75% (IQ3) | 98.9% | 99.2% |
| Interquartile Range (IQR) | 1.5% | 2.3% |
| Standard Deviation (Sample) | 1.6% | 1.8% |
| Standard Deviation (Population) | 1.6% | 1.8% |
Demographics Similar to U.S. Virgin Islanders and Armenians by Kindergarten
In terms of kindergarten, the demographic groups most similar to U.S. Virgin Islanders are Korean (97.6%, a difference of 0.010%), Liberian (97.6%, a difference of 0.020%), Immigrants from Indonesia (97.6%, a difference of 0.020%), Asian (97.6%, a difference of 0.030%), and Bolivian (97.6%, a difference of 0.030%). Similarly, the demographic groups most similar to Armenians are Jamaican (97.6%, a difference of 0.010%), Immigrants from Colombia (97.6%, a difference of 0.020%), Immigrants from Asia (97.6%, a difference of 0.030%), Immigrants from Congo (97.6%, a difference of 0.030%), and Yaqui (97.6%, a difference of 0.030%).
| Demographics | Rating | Rank | Kindergarten |
| U.S. Virgin Islanders | 1.7 /100 | #239 | Tragic 97.6% |
| Koreans | 1.6 /100 | #240 | Tragic 97.6% |
| Liberians | 1.3 /100 | #241 | Tragic 97.6% |
| Immigrants | Indonesia | 1.3 /100 | #242 | Tragic 97.6% |
| Asians | 1.2 /100 | #243 | Tragic 97.6% |
| Bolivians | 1.2 /100 | #244 | Tragic 97.6% |
| South Americans | 1.1 /100 | #245 | Tragic 97.6% |
| Indians (Asian) | 1.0 /100 | #246 | Tragic 97.6% |
| Immigrants | Eastern Africa | 1.0 /100 | #247 | Tragic 97.6% |
| Immigrants | Middle Africa | 1.0 /100 | #248 | Tragic 97.6% |
| Peruvians | 1.0 /100 | #249 | Tragic 97.6% |
| Immigrants | Senegal | 0.9 /100 | #250 | Tragic 97.6% |
| Ethiopians | 0.9 /100 | #251 | Tragic 97.6% |
| Immigrants | Iraq | 0.9 /100 | #252 | Tragic 97.6% |
| Immigrants | Africa | 0.8 /100 | #253 | Tragic 97.6% |
| Immigrants | Asia | 0.8 /100 | #254 | Tragic 97.6% |
| Immigrants | Congo | 0.8 /100 | #255 | Tragic 97.6% |
| Yaqui | 0.7 /100 | #256 | Tragic 97.6% |
| Immigrants | Colombia | 0.6 /100 | #257 | Tragic 97.6% |
| Jamaicans | 0.6 /100 | #258 | Tragic 97.6% |
| Armenians | 0.5 /100 | #259 | Tragic 97.6% |