Turkish vs Japanese Unemployment
COMPARE
Turkish
Japanese
Unemployment
Unemployment Comparison
Turks
Japanese
4.9%
UNEMPLOYMENT
98.0/ 100
METRIC RATING
75th/ 347
METRIC RANK
5.6%
UNEMPLOYMENT
0.8/ 100
METRIC RATING
250th/ 347
METRIC RANK
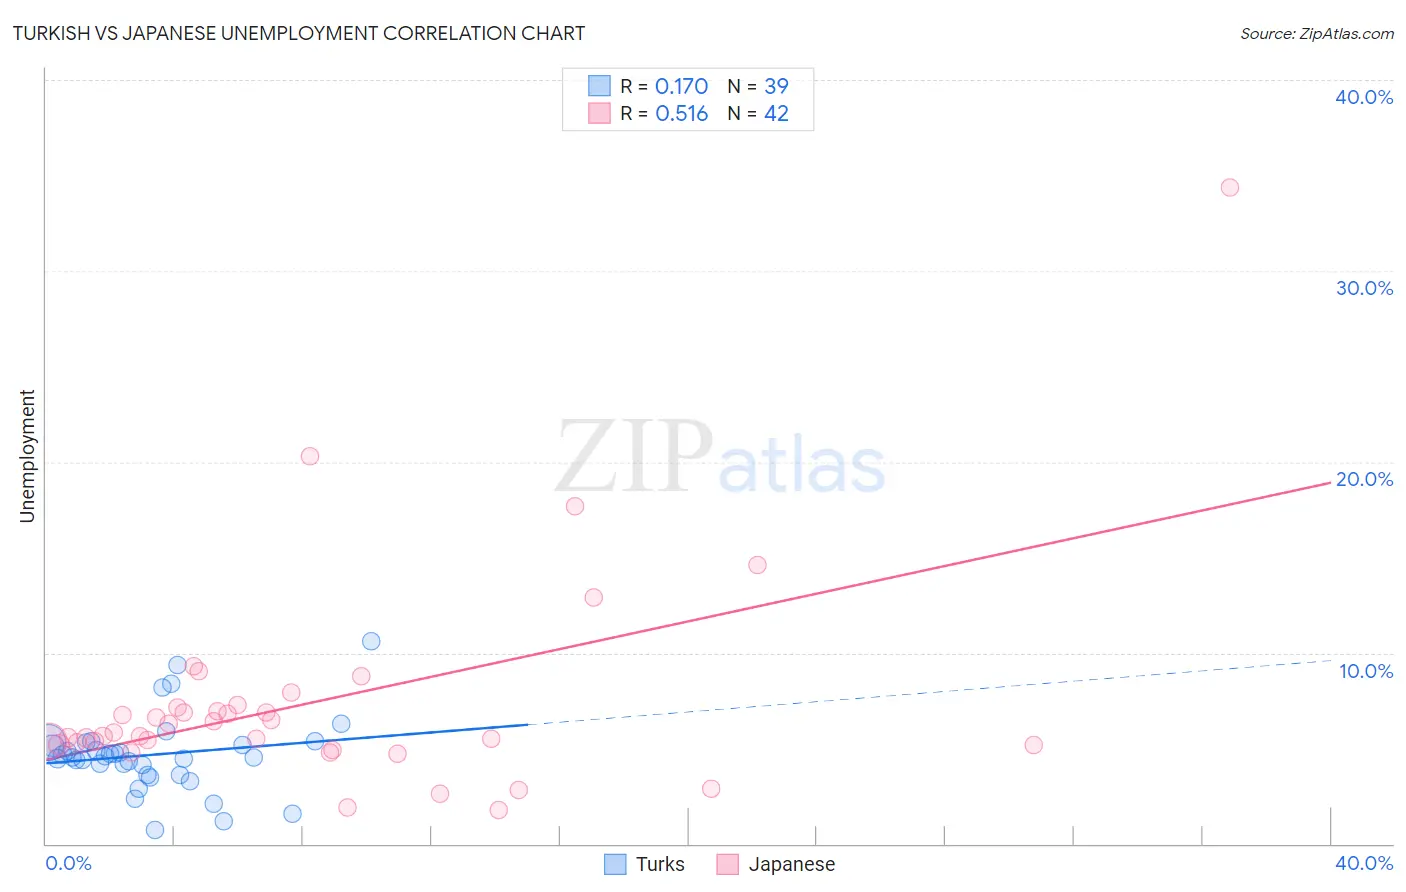
Turkish vs Japanese Unemployment Correlation Chart
The statistical analysis conducted on geographies consisting of 271,755,353 people shows a poor positive correlation between the proportion of Turks and unemployment in the United States with a correlation coefficient (R) of 0.170 and weighted average of 4.9%. Similarly, the statistical analysis conducted on geographies consisting of 249,076,576 people shows a substantial positive correlation between the proportion of Japanese and unemployment in the United States with a correlation coefficient (R) of 0.516 and weighted average of 5.6%, a difference of 14.3%.
Unemployment Correlation Summary
| Measurement | Turkish | Japanese |
| Minimum | 0.70% | 1.8% |
| Maximum | 10.6% | 34.4% |
| Range | 9.9% | 32.6% |
| Mean | 4.7% | 7.4% |
| Median | 4.5% | 5.8% |
| Interquartile 25% (IQ1) | 3.6% | 5.2% |
| Interquartile 75% (IQ3) | 5.3% | 7.1% |
| Interquartile Range (IQR) | 1.7% | 1.9% |
| Standard Deviation (Sample) | 2.0% | 5.6% |
| Standard Deviation (Population) | 2.0% | 5.6% |
Similar Demographics by Unemployment
Demographics Similar to Turks by Unemployment
In terms of unemployment, the demographic groups most similar to Turks are German Russian (4.9%, a difference of 0.030%), Cypriot (4.9%, a difference of 0.080%), Immigrants from Northern Europe (4.9%, a difference of 0.13%), Okinawan (4.9%, a difference of 0.13%), and Paraguayan (4.9%, a difference of 0.23%).
| Demographics | Rating | Rank | Unemployment |
| Slavs | 98.6 /100 | #68 | Exceptional 4.9% |
| Immigrants | North America | 98.5 /100 | #69 | Exceptional 4.9% |
| Serbians | 98.4 /100 | #70 | Exceptional 4.9% |
| Immigrants | Japan | 98.3 /100 | #71 | Exceptional 4.9% |
| Burmese | 98.3 /100 | #72 | Exceptional 4.9% |
| Paraguayans | 98.3 /100 | #73 | Exceptional 4.9% |
| Immigrants | Northern Europe | 98.2 /100 | #74 | Exceptional 4.9% |
| Turks | 98.0 /100 | #75 | Exceptional 4.9% |
| German Russians | 98.0 /100 | #76 | Exceptional 4.9% |
| Cypriots | 97.9 /100 | #77 | Exceptional 4.9% |
| Okinawans | 97.9 /100 | #78 | Exceptional 4.9% |
| Canadians | 97.7 /100 | #79 | Exceptional 5.0% |
| Immigrants | Sweden | 97.6 /100 | #80 | Exceptional 5.0% |
| Basques | 97.6 /100 | #81 | Exceptional 5.0% |
| Fijians | 97.6 /100 | #82 | Exceptional 5.0% |
Demographics Similar to Japanese by Unemployment
In terms of unemployment, the demographic groups most similar to Japanese are Cajun (5.6%, a difference of 0.010%), Liberian (5.6%, a difference of 0.27%), Immigrants from Cameroon (5.6%, a difference of 0.40%), Kiowa (5.7%, a difference of 0.47%), and Bermudan (5.6%, a difference of 0.55%).
| Demographics | Rating | Rank | Unemployment |
| Marshallese | 1.3 /100 | #243 | Tragic 5.6% |
| Dutch West Indians | 1.2 /100 | #244 | Tragic 5.6% |
| French American Indians | 1.2 /100 | #245 | Tragic 5.6% |
| Bermudans | 1.1 /100 | #246 | Tragic 5.6% |
| Immigrants | Cameroon | 1.0 /100 | #247 | Tragic 5.6% |
| Liberians | 0.9 /100 | #248 | Tragic 5.6% |
| Cajuns | 0.8 /100 | #249 | Tragic 5.6% |
| Japanese | 0.8 /100 | #250 | Tragic 5.6% |
| Kiowa | 0.6 /100 | #251 | Tragic 5.7% |
| Hondurans | 0.3 /100 | #252 | Tragic 5.7% |
| Central Americans | 0.3 /100 | #253 | Tragic 5.7% |
| Immigrants | Honduras | 0.3 /100 | #254 | Tragic 5.7% |
| Immigrants | Portugal | 0.2 /100 | #255 | Tragic 5.7% |
| Guatemalans | 0.2 /100 | #256 | Tragic 5.8% |
| Yaqui | 0.2 /100 | #257 | Tragic 5.8% |