Turkish vs Immigrants from England Unemployment
COMPARE
Turkish
Immigrants from England
Unemployment
Unemployment Comparison
Turks
Immigrants from England
4.9%
UNEMPLOYMENT
98.0/ 100
METRIC RATING
75th/ 347
METRIC RANK
5.0%
UNEMPLOYMENT
95.2/ 100
METRIC RATING
96th/ 347
METRIC RANK
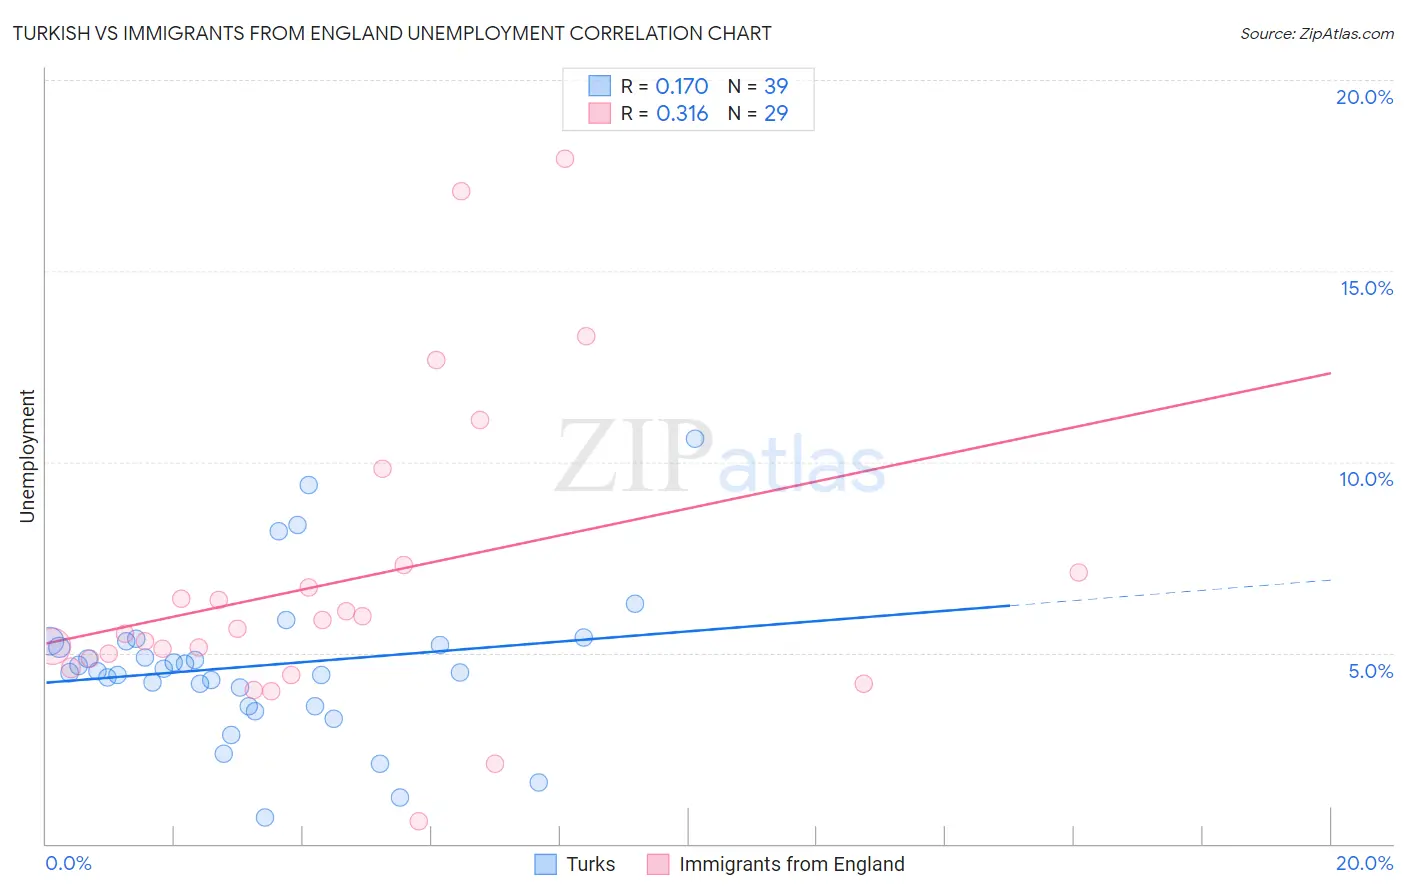
Turkish vs Immigrants from England Unemployment Correlation Chart
The statistical analysis conducted on geographies consisting of 271,755,353 people shows a poor positive correlation between the proportion of Turks and unemployment in the United States with a correlation coefficient (R) of 0.170 and weighted average of 4.9%. Similarly, the statistical analysis conducted on geographies consisting of 391,444,946 people shows a mild positive correlation between the proportion of Immigrants from England and unemployment in the United States with a correlation coefficient (R) of 0.316 and weighted average of 5.0%, a difference of 1.5%.
Unemployment Correlation Summary
| Measurement | Turkish | Immigrants from England |
| Minimum | 0.70% | 0.60% |
| Maximum | 10.6% | 17.9% |
| Range | 9.9% | 17.3% |
| Mean | 4.7% | 6.9% |
| Median | 4.5% | 5.6% |
| Interquartile 25% (IQ1) | 3.6% | 4.7% |
| Interquartile 75% (IQ3) | 5.3% | 7.2% |
| Interquartile Range (IQR) | 1.7% | 2.5% |
| Standard Deviation (Sample) | 2.0% | 4.0% |
| Standard Deviation (Population) | 2.0% | 3.9% |
Similar Demographics by Unemployment
Demographics Similar to Turks by Unemployment
In terms of unemployment, the demographic groups most similar to Turks are German Russian (4.9%, a difference of 0.030%), Cypriot (4.9%, a difference of 0.080%), Immigrants from Northern Europe (4.9%, a difference of 0.13%), Okinawan (4.9%, a difference of 0.13%), and Paraguayan (4.9%, a difference of 0.23%).
| Demographics | Rating | Rank | Unemployment |
| Slavs | 98.6 /100 | #68 | Exceptional 4.9% |
| Immigrants | North America | 98.5 /100 | #69 | Exceptional 4.9% |
| Serbians | 98.4 /100 | #70 | Exceptional 4.9% |
| Immigrants | Japan | 98.3 /100 | #71 | Exceptional 4.9% |
| Burmese | 98.3 /100 | #72 | Exceptional 4.9% |
| Paraguayans | 98.3 /100 | #73 | Exceptional 4.9% |
| Immigrants | Northern Europe | 98.2 /100 | #74 | Exceptional 4.9% |
| Turks | 98.0 /100 | #75 | Exceptional 4.9% |
| German Russians | 98.0 /100 | #76 | Exceptional 4.9% |
| Cypriots | 97.9 /100 | #77 | Exceptional 4.9% |
| Okinawans | 97.9 /100 | #78 | Exceptional 4.9% |
| Canadians | 97.7 /100 | #79 | Exceptional 5.0% |
| Immigrants | Sweden | 97.6 /100 | #80 | Exceptional 5.0% |
| Basques | 97.6 /100 | #81 | Exceptional 5.0% |
| Fijians | 97.6 /100 | #82 | Exceptional 5.0% |
Demographics Similar to Immigrants from England by Unemployment
In terms of unemployment, the demographic groups most similar to Immigrants from England are Immigrants from Czechoslovakia (5.0%, a difference of 0.030%), Romanian (5.0%, a difference of 0.060%), Mongolian (5.0%, a difference of 0.13%), Immigrants from Serbia (5.0%, a difference of 0.16%), and Estonian (5.0%, a difference of 0.19%).
| Demographics | Rating | Rank | Unemployment |
| Jordanians | 96.4 /100 | #89 | Exceptional 5.0% |
| Immigrants | North Macedonia | 96.3 /100 | #90 | Exceptional 5.0% |
| Immigrants | Sudan | 96.3 /100 | #91 | Exceptional 5.0% |
| Immigrants | South Africa | 96.2 /100 | #92 | Exceptional 5.0% |
| Ukrainians | 96.0 /100 | #93 | Exceptional 5.0% |
| Immigrants | Austria | 95.9 /100 | #94 | Exceptional 5.0% |
| Immigrants | Serbia | 95.6 /100 | #95 | Exceptional 5.0% |
| Immigrants | England | 95.2 /100 | #96 | Exceptional 5.0% |
| Immigrants | Czechoslovakia | 95.1 /100 | #97 | Exceptional 5.0% |
| Romanians | 95.0 /100 | #98 | Exceptional 5.0% |
| Mongolians | 94.8 /100 | #99 | Exceptional 5.0% |
| Estonians | 94.6 /100 | #100 | Exceptional 5.0% |
| Americans | 94.3 /100 | #101 | Exceptional 5.0% |
| Immigrants | Argentina | 94.1 /100 | #102 | Exceptional 5.0% |
| Chickasaw | 94.0 /100 | #103 | Exceptional 5.0% |