Turkish vs Immigrants from Croatia Unemployment
COMPARE
Turkish
Immigrants from Croatia
Unemployment
Unemployment Comparison
Turks
Immigrants from Croatia
4.9%
UNEMPLOYMENT
98.0/ 100
METRIC RATING
75th/ 347
METRIC RANK
5.1%
UNEMPLOYMENT
86.8/ 100
METRIC RATING
131st/ 347
METRIC RANK
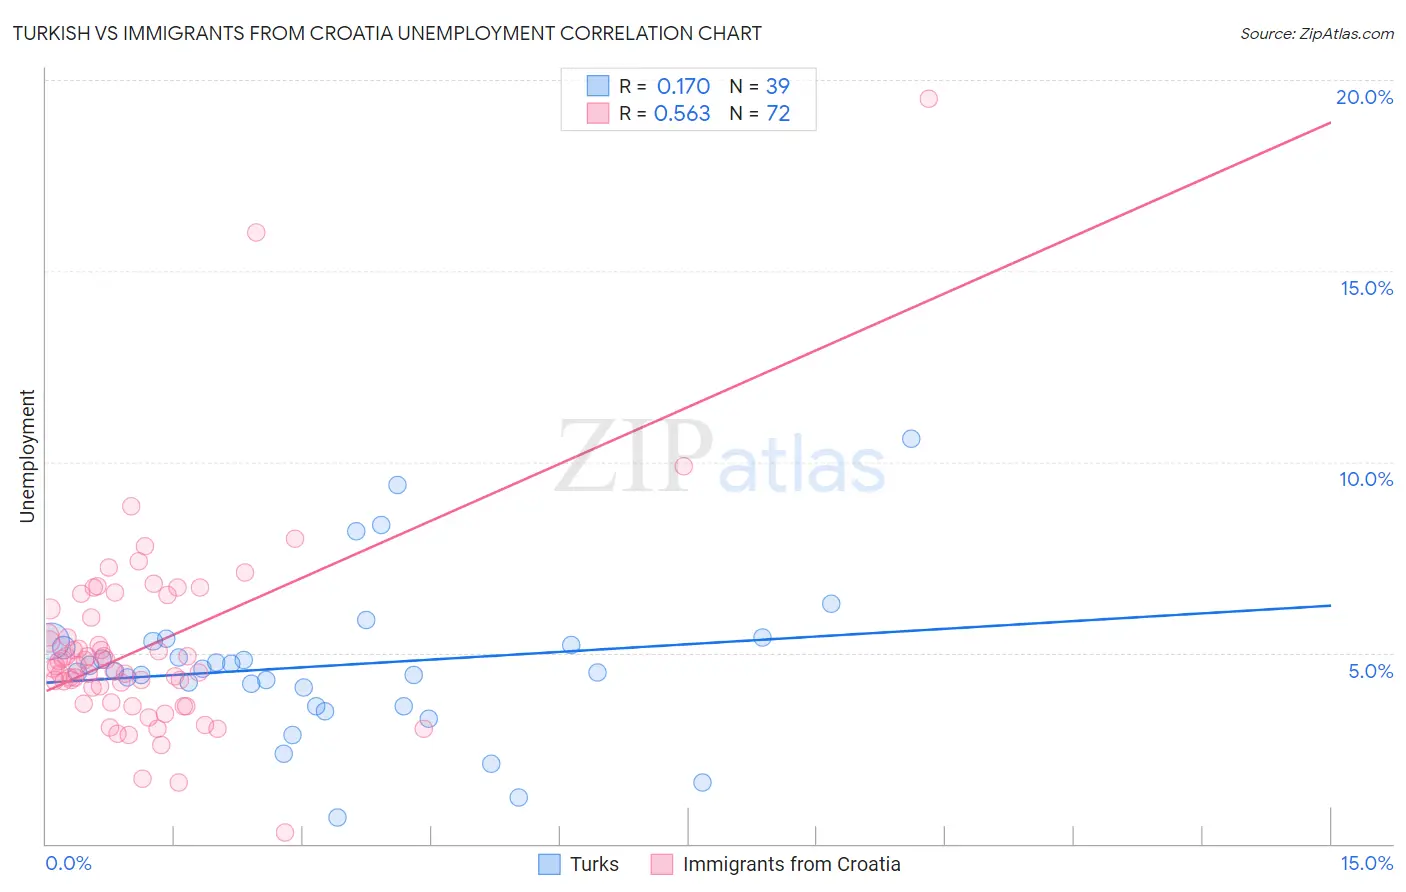
Turkish vs Immigrants from Croatia Unemployment Correlation Chart
The statistical analysis conducted on geographies consisting of 271,755,353 people shows a poor positive correlation between the proportion of Turks and unemployment in the United States with a correlation coefficient (R) of 0.170 and weighted average of 4.9%. Similarly, the statistical analysis conducted on geographies consisting of 132,546,929 people shows a substantial positive correlation between the proportion of Immigrants from Croatia and unemployment in the United States with a correlation coefficient (R) of 0.563 and weighted average of 5.1%, a difference of 3.3%.
Unemployment Correlation Summary
| Measurement | Turkish | Immigrants from Croatia |
| Minimum | 0.70% | 0.30% |
| Maximum | 10.6% | 19.5% |
| Range | 9.9% | 19.2% |
| Mean | 4.7% | 5.2% |
| Median | 4.5% | 4.7% |
| Interquartile 25% (IQ1) | 3.6% | 3.9% |
| Interquartile 75% (IQ3) | 5.3% | 6.0% |
| Interquartile Range (IQR) | 1.7% | 2.2% |
| Standard Deviation (Sample) | 2.0% | 2.7% |
| Standard Deviation (Population) | 2.0% | 2.7% |
Similar Demographics by Unemployment
Demographics Similar to Turks by Unemployment
In terms of unemployment, the demographic groups most similar to Turks are German Russian (4.9%, a difference of 0.030%), Cypriot (4.9%, a difference of 0.080%), Immigrants from Northern Europe (4.9%, a difference of 0.13%), Okinawan (4.9%, a difference of 0.13%), and Paraguayan (4.9%, a difference of 0.23%).
| Demographics | Rating | Rank | Unemployment |
| Slavs | 98.6 /100 | #68 | Exceptional 4.9% |
| Immigrants | North America | 98.5 /100 | #69 | Exceptional 4.9% |
| Serbians | 98.4 /100 | #70 | Exceptional 4.9% |
| Immigrants | Japan | 98.3 /100 | #71 | Exceptional 4.9% |
| Burmese | 98.3 /100 | #72 | Exceptional 4.9% |
| Paraguayans | 98.3 /100 | #73 | Exceptional 4.9% |
| Immigrants | Northern Europe | 98.2 /100 | #74 | Exceptional 4.9% |
| Turks | 98.0 /100 | #75 | Exceptional 4.9% |
| German Russians | 98.0 /100 | #76 | Exceptional 4.9% |
| Cypriots | 97.9 /100 | #77 | Exceptional 4.9% |
| Okinawans | 97.9 /100 | #78 | Exceptional 4.9% |
| Canadians | 97.7 /100 | #79 | Exceptional 5.0% |
| Immigrants | Sweden | 97.6 /100 | #80 | Exceptional 5.0% |
| Basques | 97.6 /100 | #81 | Exceptional 5.0% |
| Fijians | 97.6 /100 | #82 | Exceptional 5.0% |
Demographics Similar to Immigrants from Croatia by Unemployment
In terms of unemployment, the demographic groups most similar to Immigrants from Croatia are Immigrants from Ethiopia (5.1%, a difference of 0.010%), Immigrants from Jordan (5.1%, a difference of 0.020%), Iranian (5.1%, a difference of 0.030%), Immigrants from Europe (5.1%, a difference of 0.060%), and Immigrants from Burma/Myanmar (5.1%, a difference of 0.070%).
| Demographics | Rating | Rank | Unemployment |
| Ethiopians | 88.6 /100 | #124 | Excellent 5.1% |
| Immigrants | Eastern Asia | 88.3 /100 | #125 | Excellent 5.1% |
| Kenyans | 88.2 /100 | #126 | Excellent 5.1% |
| Immigrants | Kenya | 88.2 /100 | #127 | Excellent 5.1% |
| Immigrants | Eastern Africa | 88.1 /100 | #128 | Excellent 5.1% |
| Immigrants | Latvia | 88.0 /100 | #129 | Excellent 5.1% |
| Iranians | 86.9 /100 | #130 | Excellent 5.1% |
| Immigrants | Croatia | 86.8 /100 | #131 | Excellent 5.1% |
| Immigrants | Ethiopia | 86.7 /100 | #132 | Excellent 5.1% |
| Immigrants | Jordan | 86.6 /100 | #133 | Excellent 5.1% |
| Immigrants | Europe | 86.3 /100 | #134 | Excellent 5.1% |
| Immigrants | Burma/Myanmar | 86.2 /100 | #135 | Excellent 5.1% |
| Immigrants | Spain | 86.2 /100 | #136 | Excellent 5.1% |
| Immigrants | Saudi Arabia | 85.6 /100 | #137 | Excellent 5.1% |
| Immigrants | Hungary | 85.6 /100 | #138 | Excellent 5.1% |