Senegalese vs Subsaharan African Unemployment Among Ages 45 to 54 years
COMPARE
Senegalese
Subsaharan African
Unemployment Among Ages 45 to 54 years
Unemployment Among Ages 45 to 54 years Comparison
Senegalese
Sub-Saharan Africans
5.1%
UNEMPLOYMENT AMONG AGES 45 TO 54 YEARS
0.0/ 100
METRIC RATING
286th/ 347
METRIC RANK
4.9%
UNEMPLOYMENT AMONG AGES 45 TO 54 YEARS
0.2/ 100
METRIC RATING
258th/ 347
METRIC RANK
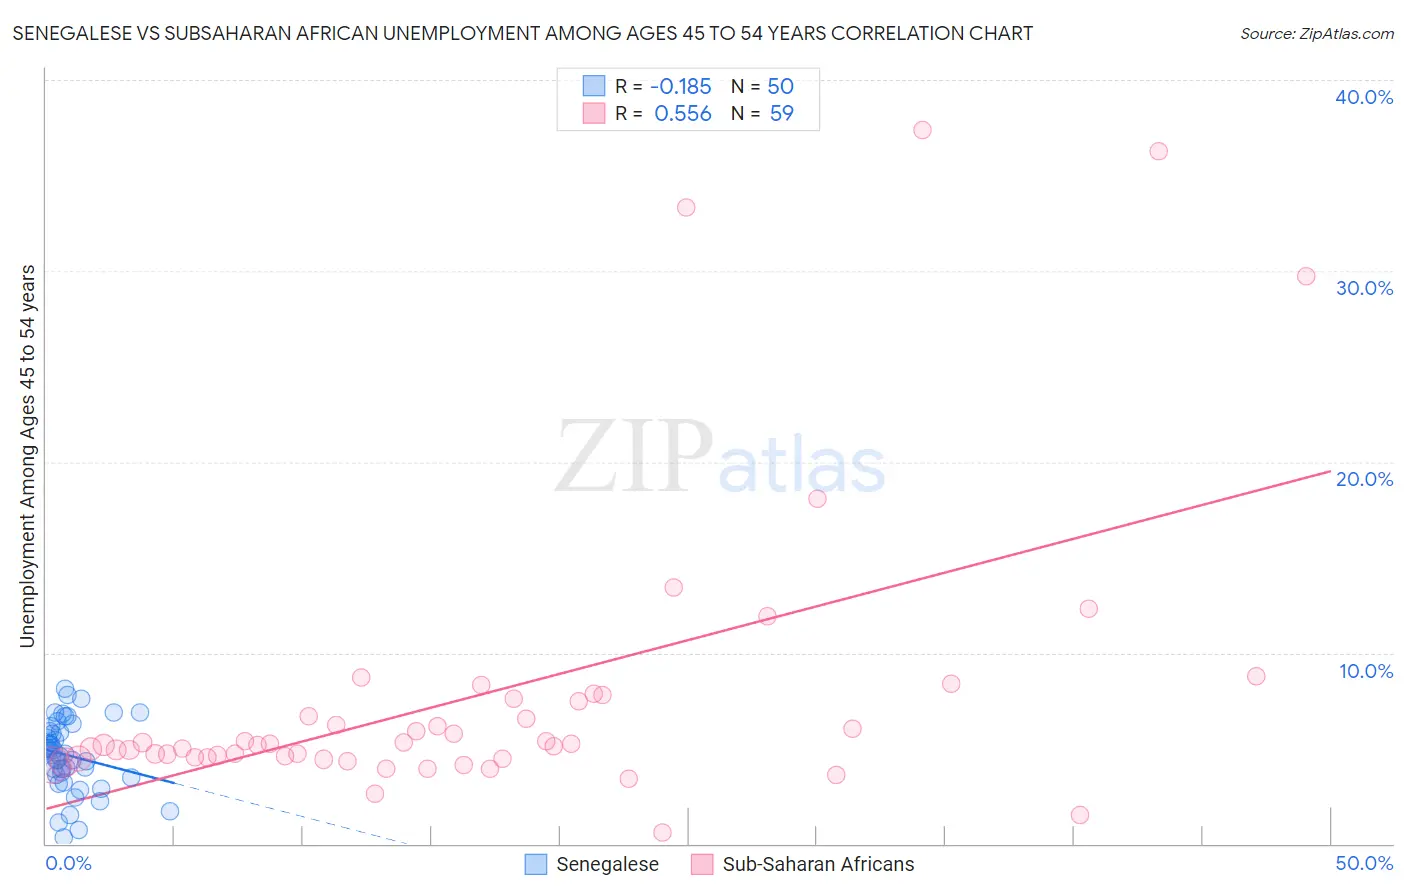
Senegalese vs Subsaharan African Unemployment Among Ages 45 to 54 years Correlation Chart
The statistical analysis conducted on geographies consisting of 77,807,393 people shows a poor negative correlation between the proportion of Senegalese and unemployment rate among population between the ages 45 and 54 in the United States with a correlation coefficient (R) of -0.185 and weighted average of 5.1%. Similarly, the statistical analysis conducted on geographies consisting of 486,803,720 people shows a substantial positive correlation between the proportion of Sub-Saharan Africans and unemployment rate among population between the ages 45 and 54 in the United States with a correlation coefficient (R) of 0.556 and weighted average of 4.9%, a difference of 5.6%.
Unemployment Among Ages 45 to 54 years Correlation Summary
| Measurement | Senegalese | Subsaharan African |
| Minimum | 0.30% | 0.60% |
| Maximum | 8.1% | 37.4% |
| Range | 7.8% | 36.8% |
| Mean | 4.6% | 7.8% |
| Median | 4.7% | 5.2% |
| Interquartile 25% (IQ1) | 3.6% | 4.5% |
| Interquartile 75% (IQ3) | 5.9% | 7.6% |
| Interquartile Range (IQR) | 2.3% | 3.1% |
| Standard Deviation (Sample) | 1.8% | 7.7% |
| Standard Deviation (Population) | 1.8% | 7.7% |
Similar Demographics by Unemployment Among Ages 45 to 54 years
Demographics Similar to Senegalese by Unemployment Among Ages 45 to 54 years
In terms of unemployment among ages 45 to 54 years, the demographic groups most similar to Senegalese are Iroquois (5.1%, a difference of 0.16%), Kiowa (5.1%, a difference of 0.18%), Hispanic or Latino (5.1%, a difference of 0.83%), Haitian (5.2%, a difference of 0.83%), and Immigrants from Caribbean (5.2%, a difference of 0.91%).
| Demographics | Rating | Rank | Unemployment Among Ages 45 to 54 years |
| Nepalese | 0.0 /100 | #279 | Tragic 5.0% |
| Blackfeet | 0.0 /100 | #280 | Tragic 5.1% |
| Spanish American Indians | 0.0 /100 | #281 | Tragic 5.1% |
| Africans | 0.0 /100 | #282 | Tragic 5.1% |
| Hispanics or Latinos | 0.0 /100 | #283 | Tragic 5.1% |
| Kiowa | 0.0 /100 | #284 | Tragic 5.1% |
| Iroquois | 0.0 /100 | #285 | Tragic 5.1% |
| Senegalese | 0.0 /100 | #286 | Tragic 5.1% |
| Haitians | 0.0 /100 | #287 | Tragic 5.2% |
| Immigrants | Caribbean | 0.0 /100 | #288 | Tragic 5.2% |
| Immigrants | Haiti | 0.0 /100 | #289 | Tragic 5.2% |
| Immigrants | Portugal | 0.0 /100 | #290 | Tragic 5.2% |
| Armenians | 0.0 /100 | #291 | Tragic 5.2% |
| Trinidadians and Tobagonians | 0.0 /100 | #292 | Tragic 5.2% |
| Immigrants | Senegal | 0.0 /100 | #293 | Tragic 5.2% |
Demographics Similar to Sub-Saharan Africans by Unemployment Among Ages 45 to 54 years
In terms of unemployment among ages 45 to 54 years, the demographic groups most similar to Sub-Saharan Africans are Immigrants from Western Africa (4.9%, a difference of 0.030%), Ugandan (4.9%, a difference of 0.15%), Mexican American Indian (4.9%, a difference of 0.16%), Guatemalan (4.9%, a difference of 0.17%), and Immigrants from Western Asia (4.8%, a difference of 0.18%).
| Demographics | Rating | Rank | Unemployment Among Ages 45 to 54 years |
| Hondurans | 0.4 /100 | #251 | Tragic 4.8% |
| Immigrants | Bahamas | 0.3 /100 | #252 | Tragic 4.8% |
| Moroccans | 0.3 /100 | #253 | Tragic 4.8% |
| Immigrants | Lebanon | 0.2 /100 | #254 | Tragic 4.8% |
| Immigrants | El Salvador | 0.2 /100 | #255 | Tragic 4.8% |
| Immigrants | Western Asia | 0.2 /100 | #256 | Tragic 4.8% |
| Immigrants | Western Africa | 0.2 /100 | #257 | Tragic 4.9% |
| Sub-Saharan Africans | 0.2 /100 | #258 | Tragic 4.9% |
| Ugandans | 0.1 /100 | #259 | Tragic 4.9% |
| Mexican American Indians | 0.1 /100 | #260 | Tragic 4.9% |
| Guatemalans | 0.1 /100 | #261 | Tragic 4.9% |
| Mexicans | 0.1 /100 | #262 | Tragic 4.9% |
| Immigrants | Fiji | 0.1 /100 | #263 | Tragic 4.9% |
| Immigrants | Guatemala | 0.1 /100 | #264 | Tragic 4.9% |
| Immigrants | Somalia | 0.1 /100 | #265 | Tragic 4.9% |