Tlingit-Haida vs Pima Unemployment Among Ages 45 to 54 years
COMPARE
Tlingit-Haida
Pima
Unemployment Among Ages 45 to 54 years
Unemployment Among Ages 45 to 54 years Comparison
Tlingit-Haida
Pima
4.7%
UNEMPLOYMENT AMONG AGES 45 TO 54 YEARS
2.3/ 100
METRIC RATING
236th/ 347
METRIC RANK
6.4%
UNEMPLOYMENT AMONG AGES 45 TO 54 YEARS
0.0/ 100
METRIC RATING
332nd/ 347
METRIC RANK
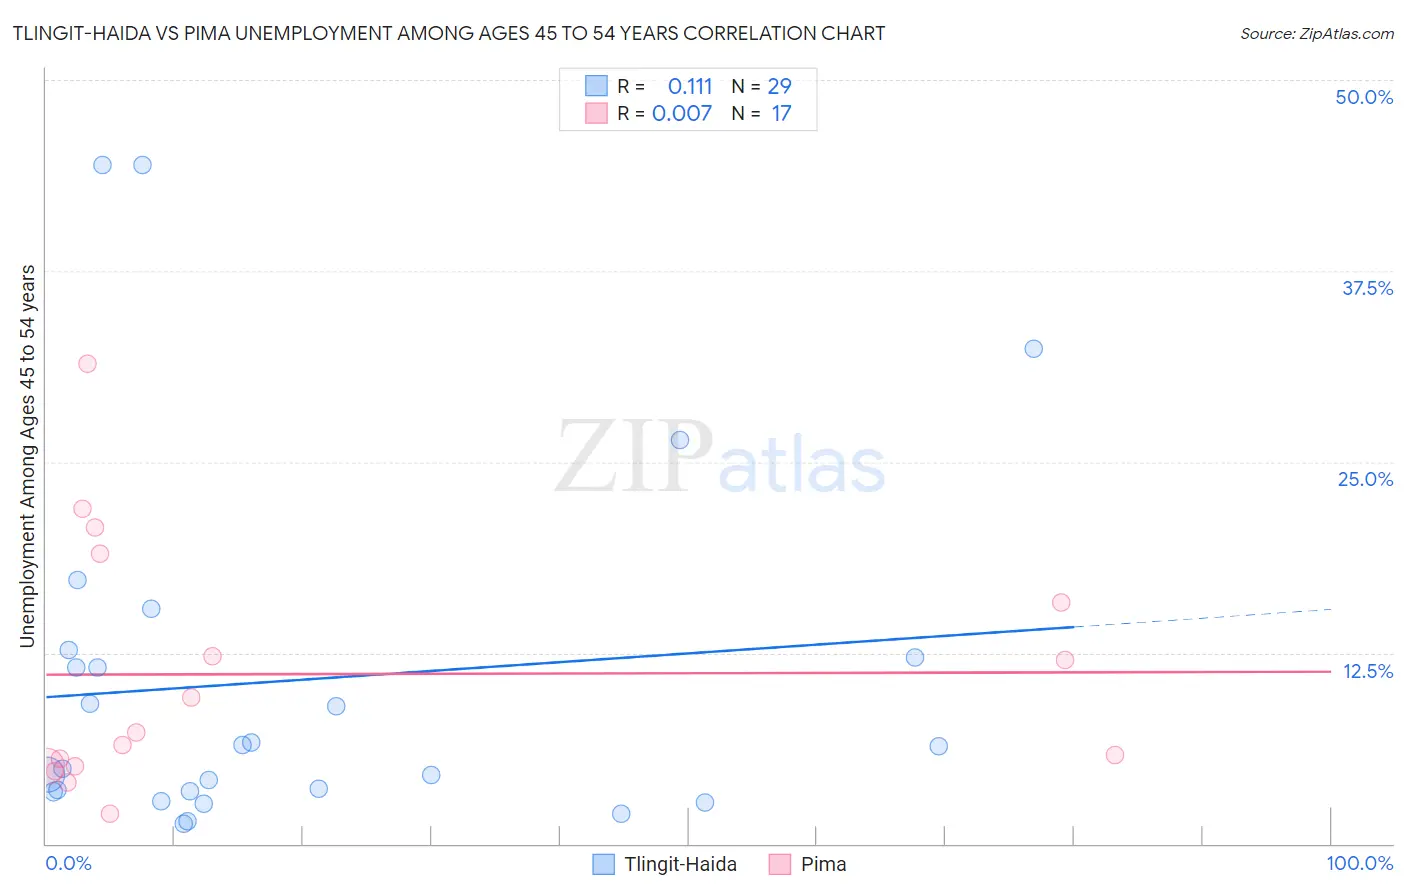
Tlingit-Haida vs Pima Unemployment Among Ages 45 to 54 years Correlation Chart
The statistical analysis conducted on geographies consisting of 60,127,685 people shows a poor positive correlation between the proportion of Tlingit-Haida and unemployment rate among population between the ages 45 and 54 in the United States with a correlation coefficient (R) of 0.111 and weighted average of 4.7%. Similarly, the statistical analysis conducted on geographies consisting of 61,232,802 people shows no correlation between the proportion of Pima and unemployment rate among population between the ages 45 and 54 in the United States with a correlation coefficient (R) of 0.007 and weighted average of 6.4%, a difference of 36.4%.
Unemployment Among Ages 45 to 54 years Correlation Summary
| Measurement | Tlingit-Haida | Pima |
| Minimum | 1.3% | 2.0% |
| Maximum | 44.4% | 31.4% |
| Range | 43.1% | 29.5% |
| Mean | 10.7% | 11.1% |
| Median | 6.4% | 7.3% |
| Interquartile 25% (IQ1) | 3.4% | 5.1% |
| Interquartile 75% (IQ3) | 12.4% | 17.4% |
| Interquartile Range (IQR) | 9.0% | 12.3% |
| Standard Deviation (Sample) | 11.8% | 8.1% |
| Standard Deviation (Population) | 11.6% | 7.9% |
Similar Demographics by Unemployment Among Ages 45 to 54 years
Demographics Similar to Tlingit-Haida by Unemployment Among Ages 45 to 54 years
In terms of unemployment among ages 45 to 54 years, the demographic groups most similar to Tlingit-Haida are Cree (4.7%, a difference of 0.010%), Soviet Union (4.7%, a difference of 0.16%), Immigrants (4.7%, a difference of 0.18%), Ottawa (4.7%, a difference of 0.21%), and Immigrants from Ireland (4.7%, a difference of 0.22%).
| Demographics | Rating | Rank | Unemployment Among Ages 45 to 54 years |
| Immigrants | Israel | 3.0 /100 | #229 | Tragic 4.7% |
| Japanese | 2.8 /100 | #230 | Tragic 4.7% |
| Immigrants | Ireland | 2.7 /100 | #231 | Tragic 4.7% |
| Ottawa | 2.7 /100 | #232 | Tragic 4.7% |
| Immigrants | Immigrants | 2.6 /100 | #233 | Tragic 4.7% |
| Soviet Union | 2.6 /100 | #234 | Tragic 4.7% |
| Cree | 2.3 /100 | #235 | Tragic 4.7% |
| Tlingit-Haida | 2.3 /100 | #236 | Tragic 4.7% |
| Alsatians | 1.6 /100 | #237 | Tragic 4.7% |
| Yaqui | 1.4 /100 | #238 | Tragic 4.7% |
| Spanish Americans | 1.4 /100 | #239 | Tragic 4.7% |
| Immigrants | Iraq | 1.3 /100 | #240 | Tragic 4.7% |
| Delaware | 1.3 /100 | #241 | Tragic 4.8% |
| Central Americans | 1.3 /100 | #242 | Tragic 4.8% |
| Portuguese | 1.1 /100 | #243 | Tragic 4.8% |
Demographics Similar to Pima by Unemployment Among Ages 45 to 54 years
In terms of unemployment among ages 45 to 54 years, the demographic groups most similar to Pima are Immigrants from Yemen (6.5%, a difference of 1.7%), Tohono O'odham (6.3%, a difference of 2.7%), Immigrants from Dominican Republic (6.3%, a difference of 2.8%), Sioux (6.6%, a difference of 2.8%), and Alaska Native (6.3%, a difference of 2.9%).
| Demographics | Rating | Rank | Unemployment Among Ages 45 to 54 years |
| Immigrants | Armenia | 0.0 /100 | #325 | Tragic 6.1% |
| Ute | 0.0 /100 | #326 | Tragic 6.2% |
| Dominicans | 0.0 /100 | #327 | Tragic 6.2% |
| Pueblo | 0.0 /100 | #328 | Tragic 6.2% |
| Alaska Natives | 0.0 /100 | #329 | Tragic 6.3% |
| Immigrants | Dominican Republic | 0.0 /100 | #330 | Tragic 6.3% |
| Tohono O'odham | 0.0 /100 | #331 | Tragic 6.3% |
| Pima | 0.0 /100 | #332 | Tragic 6.4% |
| Immigrants | Yemen | 0.0 /100 | #333 | Tragic 6.5% |
| Sioux | 0.0 /100 | #334 | Tragic 6.6% |
| Navajo | 0.0 /100 | #335 | Tragic 6.7% |
| Puerto Ricans | 0.0 /100 | #336 | Tragic 6.8% |
| Apache | 0.0 /100 | #337 | Tragic 7.0% |
| Colville | 0.0 /100 | #338 | Tragic 7.4% |
| Arapaho | 0.0 /100 | #339 | Tragic 7.5% |