Tlingit-Haida vs Hopi Unemployment Among Ages 16 to 19 years
COMPARE
Tlingit-Haida
Hopi
Unemployment Among Ages 16 to 19 years
Unemployment Among Ages 16 to 19 years Comparison
Tlingit-Haida
Hopi
23.5%
UNEMPLOYMENT AMONG AGES 16 TO 19 YEARS
0.0/ 100
METRIC RATING
329th/ 347
METRIC RANK
30.7%
UNEMPLOYMENT AMONG AGES 16 TO 19 YEARS
0.0/ 100
METRIC RATING
345th/ 347
METRIC RANK
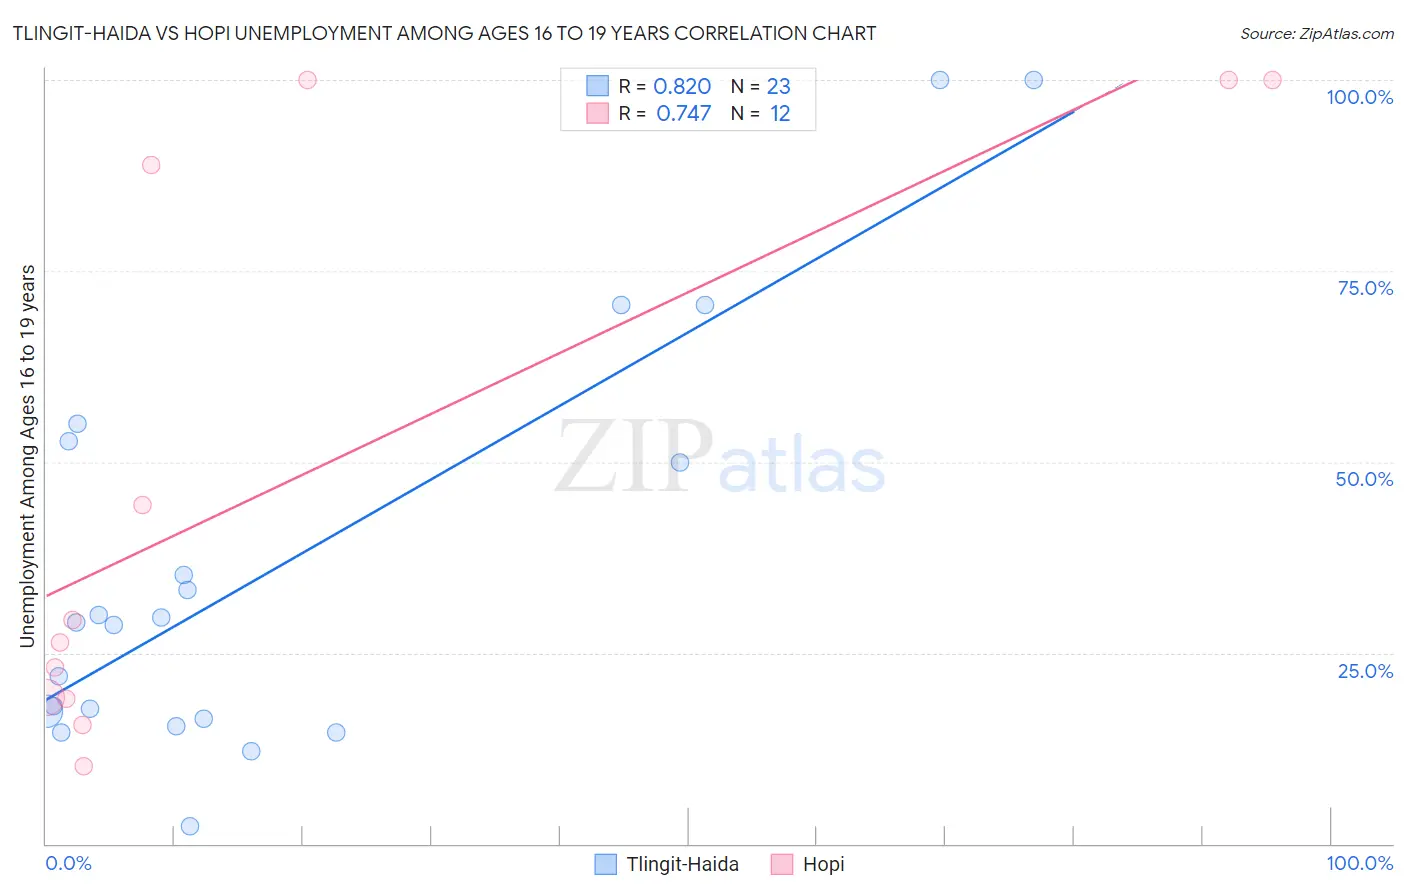
Tlingit-Haida vs Hopi Unemployment Among Ages 16 to 19 years Correlation Chart
The statistical analysis conducted on geographies consisting of 59,818,277 people shows a very strong positive correlation between the proportion of Tlingit-Haida and unemployment rate among population between the ages 16 and 19 in the United States with a correlation coefficient (R) of 0.820 and weighted average of 23.5%. Similarly, the statistical analysis conducted on geographies consisting of 73,873,422 people shows a strong positive correlation between the proportion of Hopi and unemployment rate among population between the ages 16 and 19 in the United States with a correlation coefficient (R) of 0.747 and weighted average of 30.7%, a difference of 30.2%.
Unemployment Among Ages 16 to 19 years Correlation Summary
| Measurement | Tlingit-Haida | Hopi |
| Minimum | 2.3% | 10.2% |
| Maximum | 100.0% | 100.0% |
| Range | 97.7% | 89.8% |
| Mean | 36.3% | 48.0% |
| Median | 28.9% | 27.8% |
| Interquartile 25% (IQ1) | 16.4% | 19.0% |
| Interquartile 75% (IQ3) | 52.6% | 94.5% |
| Interquartile Range (IQR) | 36.2% | 75.4% |
| Standard Deviation (Sample) | 27.2% | 37.4% |
| Standard Deviation (Population) | 26.6% | 35.8% |
Demographics Similar to Tlingit-Haida and Hopi by Unemployment Among Ages 16 to 19 years
In terms of unemployment among ages 16 to 19 years, the demographic groups most similar to Tlingit-Haida are Dominican (23.6%, a difference of 0.44%), Immigrants from Dominican Republic (23.3%, a difference of 1.1%), Pima (23.1%, a difference of 1.7%), British West Indian (24.0%, a difference of 1.8%), and Immigrants from Barbados (24.0%, a difference of 2.0%). Similarly, the demographic groups most similar to Hopi are Colville (29.7%, a difference of 3.3%), Navajo (29.0%, a difference of 5.6%), Inupiat (28.1%, a difference of 9.3%), Puerto Rican (27.5%, a difference of 11.5%), and Crow (26.2%, a difference of 16.9%).
| Demographics | Rating | Rank | Unemployment Among Ages 16 to 19 years |
| Pima | 0.0 /100 | #327 | Tragic 23.1% |
| Immigrants | Dominican Republic | 0.0 /100 | #328 | Tragic 23.3% |
| Tlingit-Haida | 0.0 /100 | #329 | Tragic 23.5% |
| Dominicans | 0.0 /100 | #330 | Tragic 23.6% |
| British West Indians | 0.0 /100 | #331 | Tragic 24.0% |
| Immigrants | Barbados | 0.0 /100 | #332 | Tragic 24.0% |
| Paiute | 0.0 /100 | #333 | Tragic 24.4% |
| Guyanese | 0.0 /100 | #334 | Tragic 24.8% |
| Arapaho | 0.0 /100 | #335 | Tragic 25.2% |
| Kiowa | 0.0 /100 | #336 | Tragic 25.2% |
| Immigrants | Guyana | 0.0 /100 | #337 | Tragic 25.5% |
| Immigrants | St. Vincent and the Grenadines | 0.0 /100 | #338 | Tragic 25.7% |
| Immigrants | Grenada | 0.0 /100 | #339 | Tragic 25.7% |
| Crow | 0.0 /100 | #340 | Tragic 26.2% |
| Puerto Ricans | 0.0 /100 | #341 | Tragic 27.5% |
| Inupiat | 0.0 /100 | #342 | Tragic 28.1% |
| Navajo | 0.0 /100 | #343 | Tragic 29.0% |
| Colville | 0.0 /100 | #344 | Tragic 29.7% |
| Hopi | 0.0 /100 | #345 | Tragic 30.7% |
| Yuman | 0.0 /100 | #346 | Tragic 37.4% |
| Yup'ik | 0.0 /100 | #347 | Tragic 41.0% |