Tlingit-Haida vs Assyrian/Chaldean/Syriac Unemployment Among Ages 16 to 19 years
COMPARE
Tlingit-Haida
Assyrian/Chaldean/Syriac
Unemployment Among Ages 16 to 19 years
Unemployment Among Ages 16 to 19 years Comparison
Tlingit-Haida
Assyrians/Chaldeans/Syriacs
23.5%
UNEMPLOYMENT AMONG AGES 16 TO 19 YEARS
0.0/ 100
METRIC RATING
329th/ 347
METRIC RANK
17.9%
UNEMPLOYMENT AMONG AGES 16 TO 19 YEARS
20.8/ 100
METRIC RATING
205th/ 347
METRIC RANK
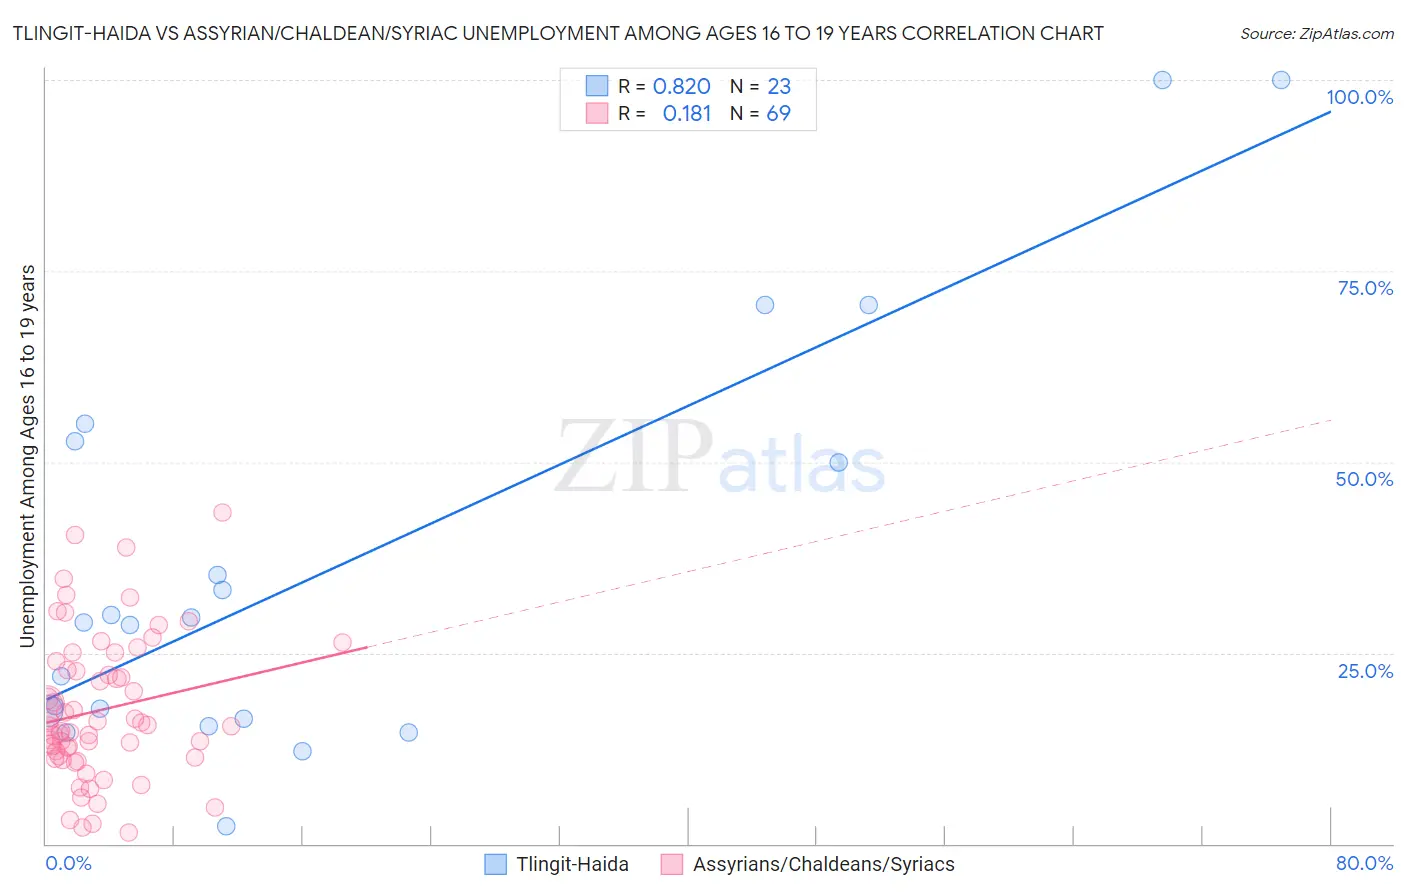
Tlingit-Haida vs Assyrian/Chaldean/Syriac Unemployment Among Ages 16 to 19 years Correlation Chart
The statistical analysis conducted on geographies consisting of 59,818,277 people shows a very strong positive correlation between the proportion of Tlingit-Haida and unemployment rate among population between the ages 16 and 19 in the United States with a correlation coefficient (R) of 0.820 and weighted average of 23.5%. Similarly, the statistical analysis conducted on geographies consisting of 108,169,043 people shows a poor positive correlation between the proportion of Assyrians/Chaldeans/Syriacs and unemployment rate among population between the ages 16 and 19 in the United States with a correlation coefficient (R) of 0.181 and weighted average of 17.9%, a difference of 31.9%.
Unemployment Among Ages 16 to 19 years Correlation Summary
| Measurement | Tlingit-Haida | Assyrian/Chaldean/Syriac |
| Minimum | 2.3% | 1.5% |
| Maximum | 100.0% | 43.4% |
| Range | 97.7% | 41.9% |
| Mean | 36.3% | 17.5% |
| Median | 28.9% | 15.4% |
| Interquartile 25% (IQ1) | 16.4% | 11.4% |
| Interquartile 75% (IQ3) | 52.6% | 23.3% |
| Interquartile Range (IQR) | 36.2% | 11.9% |
| Standard Deviation (Sample) | 27.2% | 9.3% |
| Standard Deviation (Population) | 26.6% | 9.3% |
Similar Demographics by Unemployment Among Ages 16 to 19 years
Demographics Similar to Tlingit-Haida by Unemployment Among Ages 16 to 19 years
In terms of unemployment among ages 16 to 19 years, the demographic groups most similar to Tlingit-Haida are Dominican (23.6%, a difference of 0.44%), Immigrants from Dominican Republic (23.3%, a difference of 1.1%), Pima (23.1%, a difference of 1.7%), British West Indian (24.0%, a difference of 1.8%), and Immigrants from Trinidad and Tobago (23.1%, a difference of 2.0%).
| Demographics | Rating | Rank | Unemployment Among Ages 16 to 19 years |
| Barbadians | 0.0 /100 | #322 | Tragic 22.5% |
| Yakama | 0.0 /100 | #323 | Tragic 22.5% |
| Immigrants | Armenia | 0.0 /100 | #324 | Tragic 22.6% |
| Trinidadians and Tobagonians | 0.0 /100 | #325 | Tragic 22.6% |
| Immigrants | Trinidad and Tobago | 0.0 /100 | #326 | Tragic 23.1% |
| Pima | 0.0 /100 | #327 | Tragic 23.1% |
| Immigrants | Dominican Republic | 0.0 /100 | #328 | Tragic 23.3% |
| Tlingit-Haida | 0.0 /100 | #329 | Tragic 23.5% |
| Dominicans | 0.0 /100 | #330 | Tragic 23.6% |
| British West Indians | 0.0 /100 | #331 | Tragic 24.0% |
| Immigrants | Barbados | 0.0 /100 | #332 | Tragic 24.0% |
| Paiute | 0.0 /100 | #333 | Tragic 24.4% |
| Guyanese | 0.0 /100 | #334 | Tragic 24.8% |
| Arapaho | 0.0 /100 | #335 | Tragic 25.2% |
| Kiowa | 0.0 /100 | #336 | Tragic 25.2% |
Demographics Similar to Assyrians/Chaldeans/Syriacs by Unemployment Among Ages 16 to 19 years
In terms of unemployment among ages 16 to 19 years, the demographic groups most similar to Assyrians/Chaldeans/Syriacs are Nonimmigrants (17.9%, a difference of 0.010%), Immigrants from Southern Europe (17.9%, a difference of 0.14%), Liberian (17.9%, a difference of 0.16%), Immigrants from Eastern Europe (17.8%, a difference of 0.19%), and Hawaiian (17.9%, a difference of 0.31%).
| Demographics | Rating | Rank | Unemployment Among Ages 16 to 19 years |
| Ethiopians | 29.6 /100 | #198 | Fair 17.8% |
| Immigrants | Ireland | 28.5 /100 | #199 | Fair 17.8% |
| Immigrants | Fiji | 27.7 /100 | #200 | Fair 17.8% |
| Immigrants | Ethiopia | 27.4 /100 | #201 | Fair 17.8% |
| Immigrants | Portugal | 27.2 /100 | #202 | Fair 17.8% |
| Immigrants | Eastern Europe | 23.6 /100 | #203 | Fair 17.8% |
| Immigrants | Nonimmigrants | 20.9 /100 | #204 | Fair 17.9% |
| Assyrians/Chaldeans/Syriacs | 20.8 /100 | #205 | Fair 17.9% |
| Immigrants | Southern Europe | 18.9 /100 | #206 | Poor 17.9% |
| Liberians | 18.6 /100 | #207 | Poor 17.9% |
| Hawaiians | 16.8 /100 | #208 | Poor 17.9% |
| Cherokee | 15.7 /100 | #209 | Poor 17.9% |
| Carpatho Rusyns | 15.6 /100 | #210 | Poor 17.9% |
| Guamanians/Chamorros | 14.5 /100 | #211 | Poor 17.9% |
| Argentineans | 13.8 /100 | #212 | Poor 18.0% |