Subsaharan African vs Hopi Unemployment Among Ages 16 to 19 years
COMPARE
Subsaharan African
Hopi
Unemployment Among Ages 16 to 19 years
Unemployment Among Ages 16 to 19 years Comparison
Sub-Saharan Africans
Hopi
18.7%
UNEMPLOYMENT AMONG AGES 16 TO 19 YEARS
0.4/ 100
METRIC RATING
251st/ 347
METRIC RANK
30.7%
UNEMPLOYMENT AMONG AGES 16 TO 19 YEARS
0.0/ 100
METRIC RATING
345th/ 347
METRIC RANK
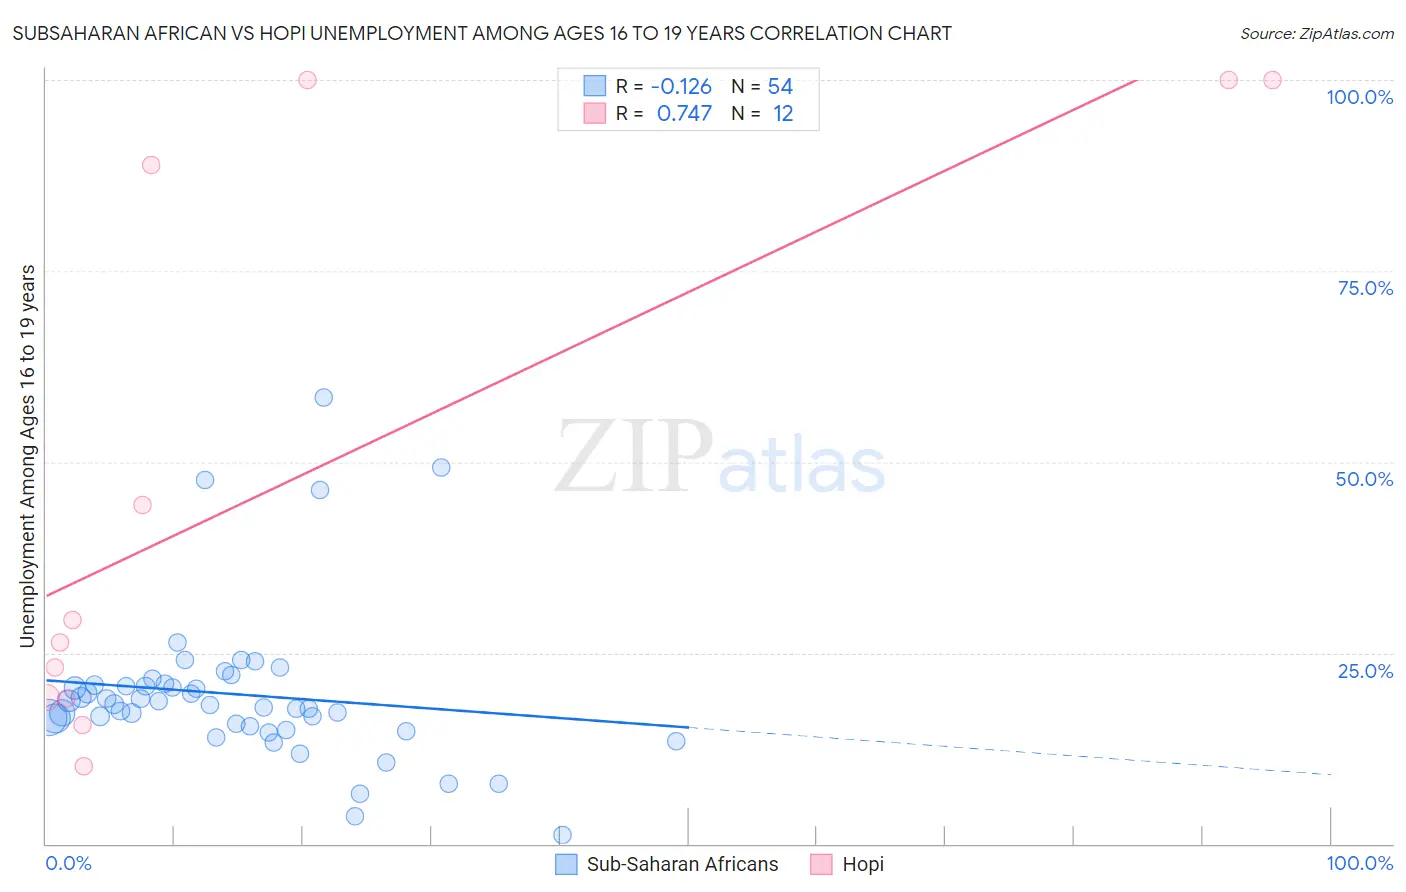
Subsaharan African vs Hopi Unemployment Among Ages 16 to 19 years Correlation Chart
The statistical analysis conducted on geographies consisting of 472,169,930 people shows a poor negative correlation between the proportion of Sub-Saharan Africans and unemployment rate among population between the ages 16 and 19 in the United States with a correlation coefficient (R) of -0.126 and weighted average of 18.7%. Similarly, the statistical analysis conducted on geographies consisting of 73,873,422 people shows a strong positive correlation between the proportion of Hopi and unemployment rate among population between the ages 16 and 19 in the United States with a correlation coefficient (R) of 0.747 and weighted average of 30.7%, a difference of 63.7%.
Unemployment Among Ages 16 to 19 years Correlation Summary
| Measurement | Subsaharan African | Hopi |
| Minimum | 1.2% | 10.2% |
| Maximum | 58.4% | 100.0% |
| Range | 57.2% | 89.8% |
| Mean | 19.6% | 48.0% |
| Median | 18.2% | 27.8% |
| Interquartile 25% (IQ1) | 15.3% | 19.0% |
| Interquartile 75% (IQ3) | 20.8% | 94.5% |
| Interquartile Range (IQR) | 5.5% | 75.4% |
| Standard Deviation (Sample) | 10.2% | 37.4% |
| Standard Deviation (Population) | 10.1% | 35.8% |
Similar Demographics by Unemployment Among Ages 16 to 19 years
Demographics Similar to Sub-Saharan Africans by Unemployment Among Ages 16 to 19 years
In terms of unemployment among ages 16 to 19 years, the demographic groups most similar to Sub-Saharan Africans are Immigrants from Guatemala (18.7%, a difference of 0.030%), Panamanian (18.7%, a difference of 0.11%), Puget Sound Salish (18.7%, a difference of 0.22%), Delaware (18.7%, a difference of 0.28%), and Immigrants from Israel (18.7%, a difference of 0.31%).
| Demographics | Rating | Rank | Unemployment Among Ages 16 to 19 years |
| Guatemalans | 0.8 /100 | #244 | Tragic 18.6% |
| Immigrants | Belarus | 0.8 /100 | #245 | Tragic 18.6% |
| Immigrants | South America | 0.5 /100 | #246 | Tragic 18.7% |
| Immigrants | Israel | 0.5 /100 | #247 | Tragic 18.7% |
| Delaware | 0.5 /100 | #248 | Tragic 18.7% |
| Puget Sound Salish | 0.5 /100 | #249 | Tragic 18.7% |
| Panamanians | 0.4 /100 | #250 | Tragic 18.7% |
| Sub-Saharan Africans | 0.4 /100 | #251 | Tragic 18.7% |
| Immigrants | Guatemala | 0.4 /100 | #252 | Tragic 18.7% |
| Central Americans | 0.3 /100 | #253 | Tragic 18.8% |
| Apache | 0.3 /100 | #254 | Tragic 18.8% |
| Immigrants | Cameroon | 0.3 /100 | #255 | Tragic 18.8% |
| Mexican American Indians | 0.3 /100 | #256 | Tragic 18.8% |
| Immigrants | Nigeria | 0.2 /100 | #257 | Tragic 18.9% |
| Immigrants | Mexico | 0.2 /100 | #258 | Tragic 18.9% |
Demographics Similar to Hopi by Unemployment Among Ages 16 to 19 years
In terms of unemployment among ages 16 to 19 years, the demographic groups most similar to Hopi are Colville (29.7%, a difference of 3.3%), Navajo (29.0%, a difference of 5.6%), Inupiat (28.1%, a difference of 9.3%), Puerto Rican (27.5%, a difference of 11.5%), and Crow (26.2%, a difference of 16.9%).
| Demographics | Rating | Rank | Unemployment Among Ages 16 to 19 years |
| Paiute | 0.0 /100 | #333 | Tragic 24.4% |
| Guyanese | 0.0 /100 | #334 | Tragic 24.8% |
| Arapaho | 0.0 /100 | #335 | Tragic 25.2% |
| Kiowa | 0.0 /100 | #336 | Tragic 25.2% |
| Immigrants | Guyana | 0.0 /100 | #337 | Tragic 25.5% |
| Immigrants | St. Vincent and the Grenadines | 0.0 /100 | #338 | Tragic 25.7% |
| Immigrants | Grenada | 0.0 /100 | #339 | Tragic 25.7% |
| Crow | 0.0 /100 | #340 | Tragic 26.2% |
| Puerto Ricans | 0.0 /100 | #341 | Tragic 27.5% |
| Inupiat | 0.0 /100 | #342 | Tragic 28.1% |
| Navajo | 0.0 /100 | #343 | Tragic 29.0% |
| Colville | 0.0 /100 | #344 | Tragic 29.7% |
| Hopi | 0.0 /100 | #345 | Tragic 30.7% |
| Yuman | 0.0 /100 | #346 | Tragic 37.4% |
| Yup'ik | 0.0 /100 | #347 | Tragic 41.0% |