Tlingit-Haida vs Immigrants from Guyana Unemployment Among Ages 16 to 19 years
COMPARE
Tlingit-Haida
Immigrants from Guyana
Unemployment Among Ages 16 to 19 years
Unemployment Among Ages 16 to 19 years Comparison
Tlingit-Haida
Immigrants from Guyana
23.5%
UNEMPLOYMENT AMONG AGES 16 TO 19 YEARS
0.0/ 100
METRIC RATING
329th/ 347
METRIC RANK
25.5%
UNEMPLOYMENT AMONG AGES 16 TO 19 YEARS
0.0/ 100
METRIC RATING
337th/ 347
METRIC RANK
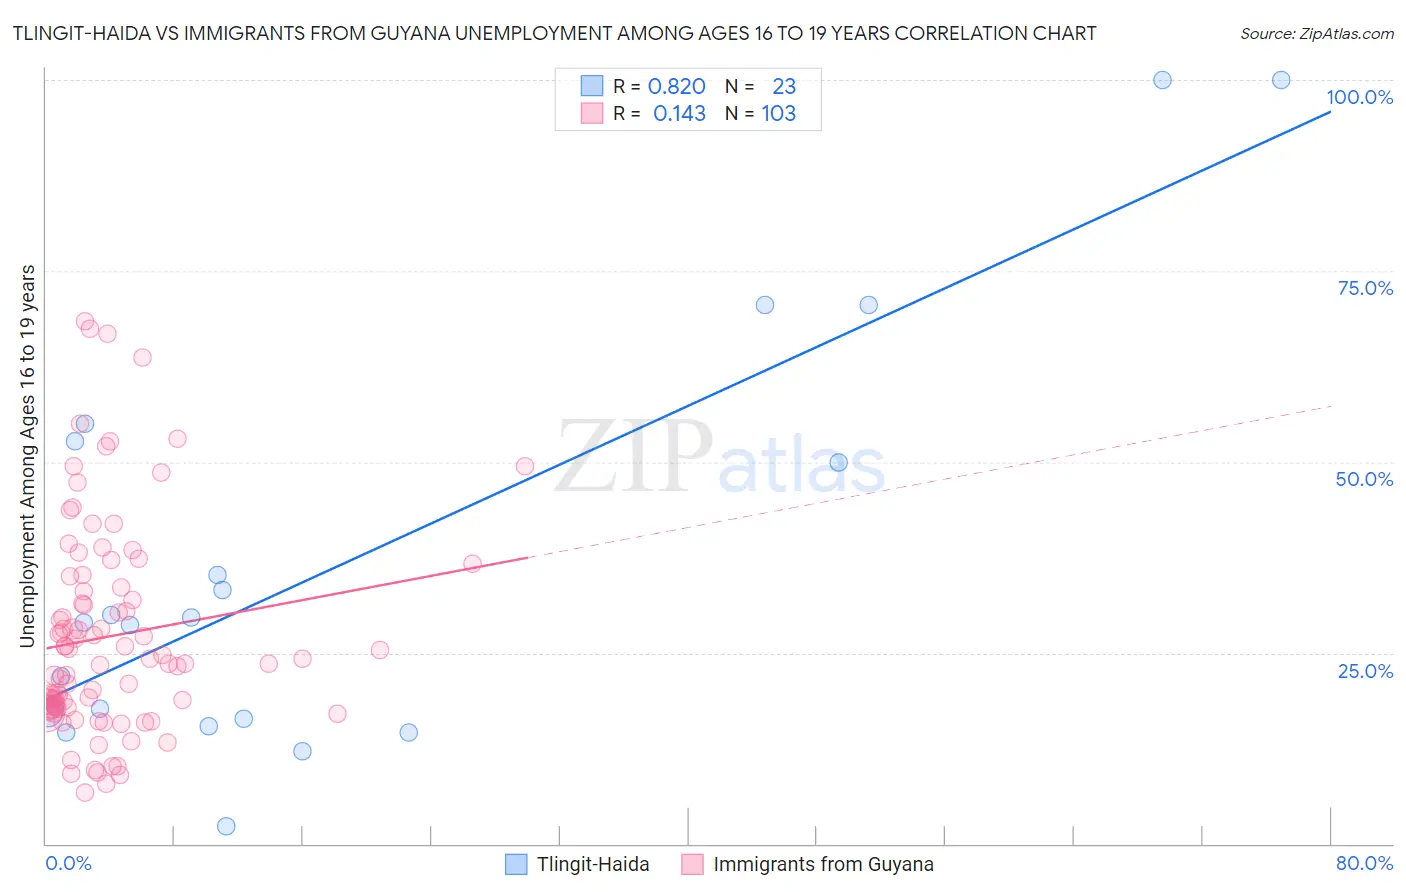
Tlingit-Haida vs Immigrants from Guyana Unemployment Among Ages 16 to 19 years Correlation Chart
The statistical analysis conducted on geographies consisting of 59,818,277 people shows a very strong positive correlation between the proportion of Tlingit-Haida and unemployment rate among population between the ages 16 and 19 in the United States with a correlation coefficient (R) of 0.820 and weighted average of 23.5%. Similarly, the statistical analysis conducted on geographies consisting of 178,672,884 people shows a poor positive correlation between the proportion of Immigrants from Guyana and unemployment rate among population between the ages 16 and 19 in the United States with a correlation coefficient (R) of 0.143 and weighted average of 25.5%, a difference of 8.2%.
Unemployment Among Ages 16 to 19 years Correlation Summary
| Measurement | Tlingit-Haida | Immigrants from Guyana |
| Minimum | 2.3% | 6.7% |
| Maximum | 100.0% | 68.4% |
| Range | 97.7% | 61.7% |
| Mean | 36.3% | 27.2% |
| Median | 28.9% | 23.6% |
| Interquartile 25% (IQ1) | 16.4% | 17.7% |
| Interquartile 75% (IQ3) | 52.6% | 33.5% |
| Interquartile Range (IQR) | 36.2% | 15.8% |
| Standard Deviation (Sample) | 27.2% | 13.8% |
| Standard Deviation (Population) | 26.6% | 13.7% |
Demographics Similar to Tlingit-Haida and Immigrants from Guyana by Unemployment Among Ages 16 to 19 years
In terms of unemployment among ages 16 to 19 years, the demographic groups most similar to Tlingit-Haida are Dominican (23.6%, a difference of 0.44%), Immigrants from Dominican Republic (23.3%, a difference of 1.1%), Pima (23.1%, a difference of 1.7%), British West Indian (24.0%, a difference of 1.8%), and Immigrants from Trinidad and Tobago (23.1%, a difference of 2.0%). Similarly, the demographic groups most similar to Immigrants from Guyana are Immigrants from St. Vincent and the Grenadines (25.7%, a difference of 0.81%), Immigrants from Grenada (25.7%, a difference of 1.0%), Kiowa (25.2%, a difference of 1.1%), Arapaho (25.2%, a difference of 1.3%), and Guyanese (24.8%, a difference of 2.6%).
| Demographics | Rating | Rank | Unemployment Among Ages 16 to 19 years |
| Yakama | 0.0 /100 | #323 | Tragic 22.5% |
| Immigrants | Armenia | 0.0 /100 | #324 | Tragic 22.6% |
| Trinidadians and Tobagonians | 0.0 /100 | #325 | Tragic 22.6% |
| Immigrants | Trinidad and Tobago | 0.0 /100 | #326 | Tragic 23.1% |
| Pima | 0.0 /100 | #327 | Tragic 23.1% |
| Immigrants | Dominican Republic | 0.0 /100 | #328 | Tragic 23.3% |
| Tlingit-Haida | 0.0 /100 | #329 | Tragic 23.5% |
| Dominicans | 0.0 /100 | #330 | Tragic 23.6% |
| British West Indians | 0.0 /100 | #331 | Tragic 24.0% |
| Immigrants | Barbados | 0.0 /100 | #332 | Tragic 24.0% |
| Paiute | 0.0 /100 | #333 | Tragic 24.4% |
| Guyanese | 0.0 /100 | #334 | Tragic 24.8% |
| Arapaho | 0.0 /100 | #335 | Tragic 25.2% |
| Kiowa | 0.0 /100 | #336 | Tragic 25.2% |
| Immigrants | Guyana | 0.0 /100 | #337 | Tragic 25.5% |
| Immigrants | St. Vincent and the Grenadines | 0.0 /100 | #338 | Tragic 25.7% |
| Immigrants | Grenada | 0.0 /100 | #339 | Tragic 25.7% |
| Crow | 0.0 /100 | #340 | Tragic 26.2% |
| Puerto Ricans | 0.0 /100 | #341 | Tragic 27.5% |
| Inupiat | 0.0 /100 | #342 | Tragic 28.1% |
| Navajo | 0.0 /100 | #343 | Tragic 29.0% |