Puerto Rican vs Hopi Unemployment Among Ages 16 to 19 years
COMPARE
Puerto Rican
Hopi
Unemployment Among Ages 16 to 19 years
Unemployment Among Ages 16 to 19 years Comparison
Puerto Ricans
Hopi
27.5%
UNEMPLOYMENT AMONG AGES 16 TO 19 YEARS
0.0/ 100
METRIC RATING
341st/ 347
METRIC RANK
30.7%
UNEMPLOYMENT AMONG AGES 16 TO 19 YEARS
0.0/ 100
METRIC RATING
345th/ 347
METRIC RANK
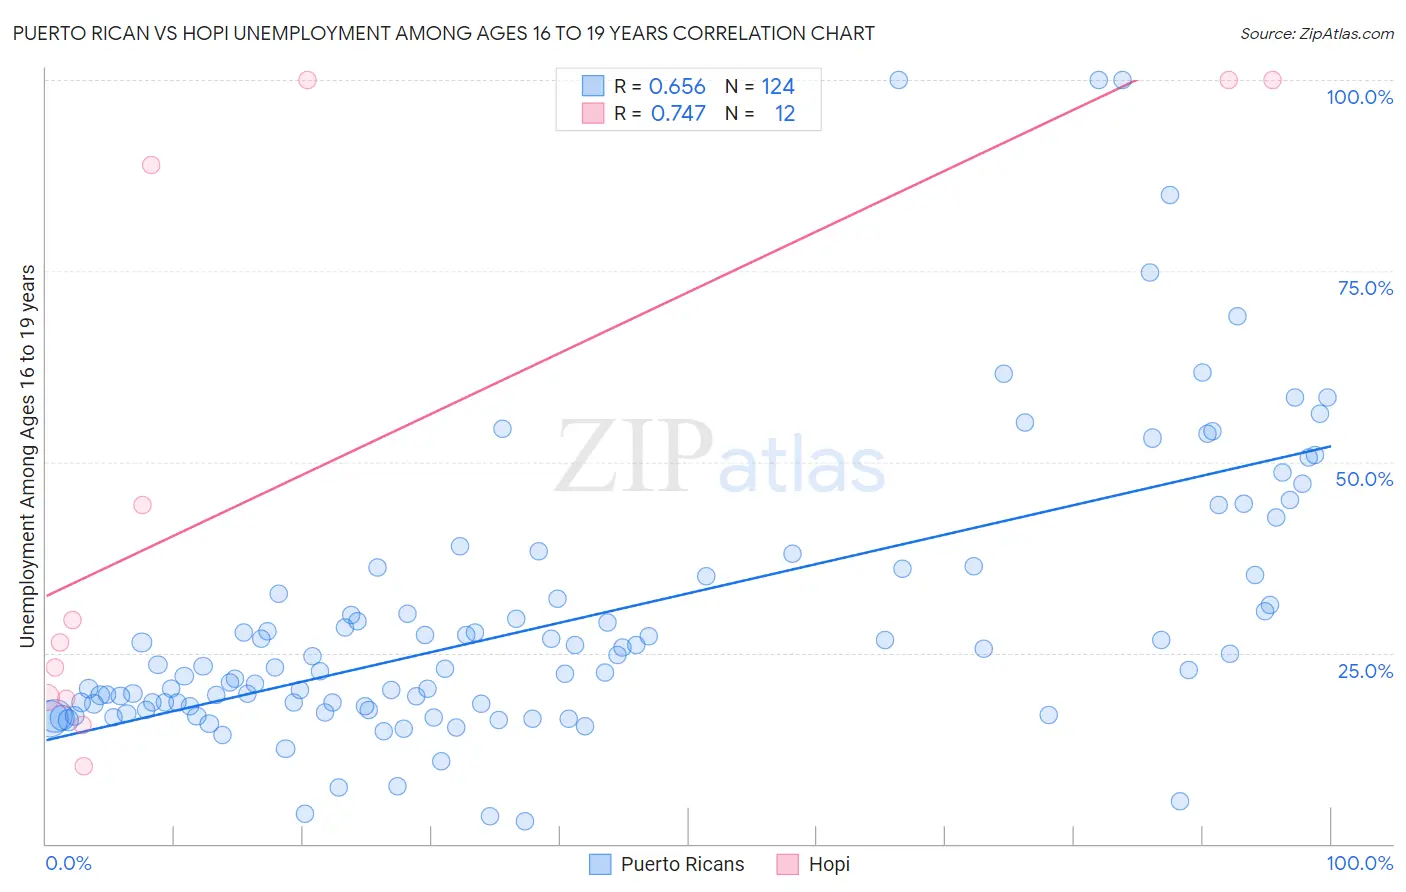
Puerto Rican vs Hopi Unemployment Among Ages 16 to 19 years Correlation Chart
The statistical analysis conducted on geographies consisting of 485,554,515 people shows a significant positive correlation between the proportion of Puerto Ricans and unemployment rate among population between the ages 16 and 19 in the United States with a correlation coefficient (R) of 0.656 and weighted average of 27.5%. Similarly, the statistical analysis conducted on geographies consisting of 73,873,422 people shows a strong positive correlation between the proportion of Hopi and unemployment rate among population between the ages 16 and 19 in the United States with a correlation coefficient (R) of 0.747 and weighted average of 30.7%, a difference of 11.5%.
Unemployment Among Ages 16 to 19 years Correlation Summary
| Measurement | Puerto Rican | Hopi |
| Minimum | 2.9% | 10.2% |
| Maximum | 100.0% | 100.0% |
| Range | 97.1% | 89.8% |
| Mean | 29.4% | 48.0% |
| Median | 23.1% | 27.8% |
| Interquartile 25% (IQ1) | 18.0% | 19.0% |
| Interquartile 75% (IQ3) | 35.1% | 94.5% |
| Interquartile Range (IQR) | 17.1% | 75.4% |
| Standard Deviation (Sample) | 18.8% | 37.4% |
| Standard Deviation (Population) | 18.7% | 35.8% |
Demographics Similar to Puerto Ricans and Hopi by Unemployment Among Ages 16 to 19 years
In terms of unemployment among ages 16 to 19 years, the demographic groups most similar to Puerto Ricans are Inupiat (28.1%, a difference of 2.0%), Crow (26.2%, a difference of 4.8%), Navajo (29.0%, a difference of 5.6%), Immigrants from Grenada (25.7%, a difference of 6.8%), and Immigrants from St. Vincent and the Grenadines (25.7%, a difference of 7.0%). Similarly, the demographic groups most similar to Hopi are Colville (29.7%, a difference of 3.3%), Navajo (29.0%, a difference of 5.6%), Inupiat (28.1%, a difference of 9.3%), Crow (26.2%, a difference of 16.9%), and Immigrants from Grenada (25.7%, a difference of 19.1%).
| Demographics | Rating | Rank | Unemployment Among Ages 16 to 19 years |
| Immigrants | Dominican Republic | 0.0 /100 | #328 | Tragic 23.3% |
| Tlingit-Haida | 0.0 /100 | #329 | Tragic 23.5% |
| Dominicans | 0.0 /100 | #330 | Tragic 23.6% |
| British West Indians | 0.0 /100 | #331 | Tragic 24.0% |
| Immigrants | Barbados | 0.0 /100 | #332 | Tragic 24.0% |
| Paiute | 0.0 /100 | #333 | Tragic 24.4% |
| Guyanese | 0.0 /100 | #334 | Tragic 24.8% |
| Arapaho | 0.0 /100 | #335 | Tragic 25.2% |
| Kiowa | 0.0 /100 | #336 | Tragic 25.2% |
| Immigrants | Guyana | 0.0 /100 | #337 | Tragic 25.5% |
| Immigrants | St. Vincent and the Grenadines | 0.0 /100 | #338 | Tragic 25.7% |
| Immigrants | Grenada | 0.0 /100 | #339 | Tragic 25.7% |
| Crow | 0.0 /100 | #340 | Tragic 26.2% |
| Puerto Ricans | 0.0 /100 | #341 | Tragic 27.5% |
| Inupiat | 0.0 /100 | #342 | Tragic 28.1% |
| Navajo | 0.0 /100 | #343 | Tragic 29.0% |
| Colville | 0.0 /100 | #344 | Tragic 29.7% |
| Hopi | 0.0 /100 | #345 | Tragic 30.7% |
| Yuman | 0.0 /100 | #346 | Tragic 37.4% |
| Yup'ik | 0.0 /100 | #347 | Tragic 41.0% |