South American Indian vs Hopi Unemployment Among Ages 16 to 19 years
COMPARE
South American Indian
Hopi
Unemployment Among Ages 16 to 19 years
Unemployment Among Ages 16 to 19 years Comparison
South American Indians
Hopi
18.0%
UNEMPLOYMENT AMONG AGES 16 TO 19 YEARS
13.0/ 100
METRIC RATING
217th/ 347
METRIC RANK
30.7%
UNEMPLOYMENT AMONG AGES 16 TO 19 YEARS
0.0/ 100
METRIC RATING
345th/ 347
METRIC RANK
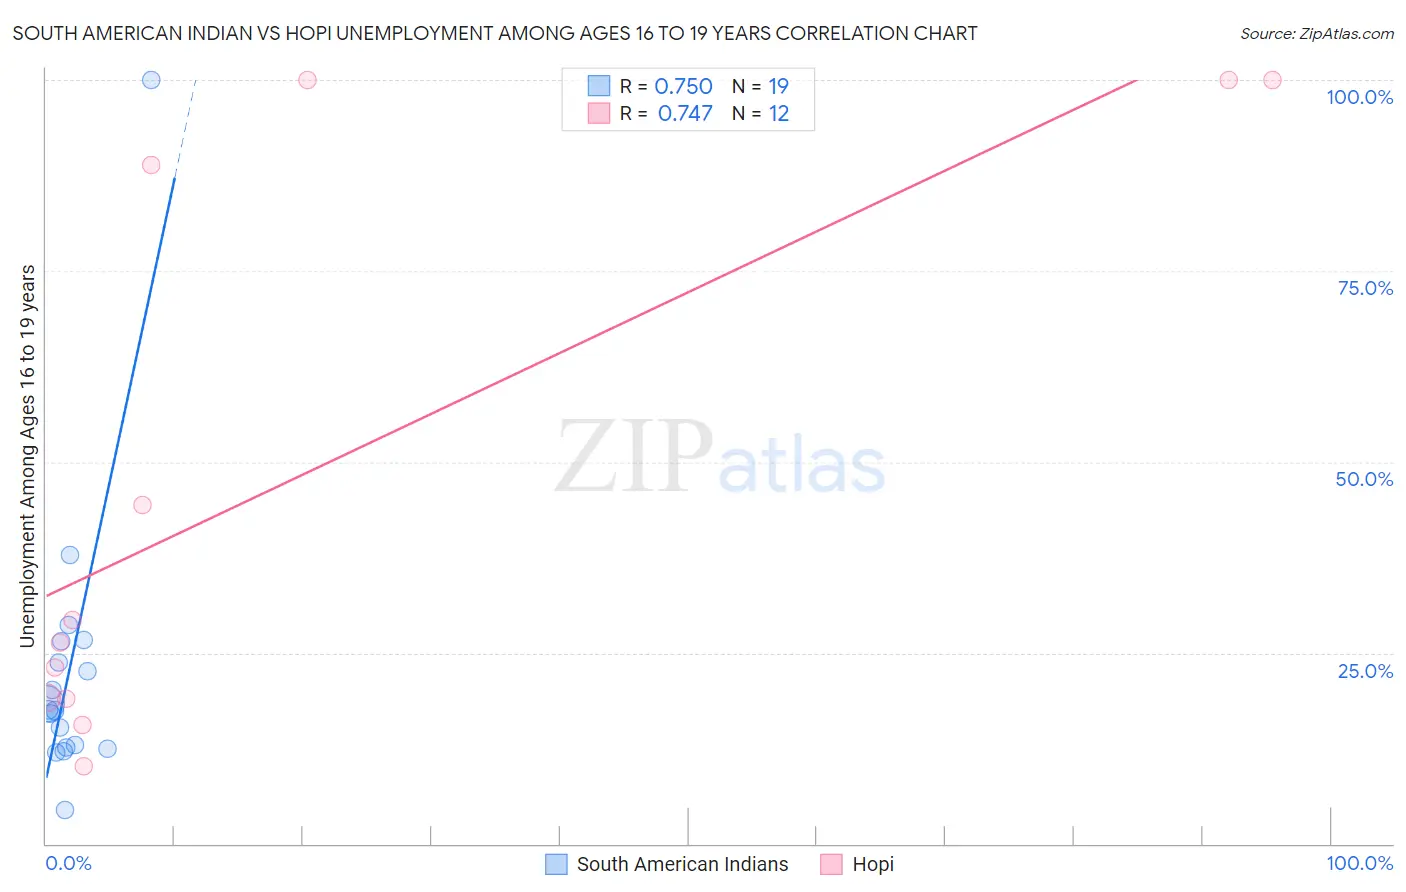
South American Indian vs Hopi Unemployment Among Ages 16 to 19 years Correlation Chart
The statistical analysis conducted on geographies consisting of 161,523,543 people shows a strong positive correlation between the proportion of South American Indians and unemployment rate among population between the ages 16 and 19 in the United States with a correlation coefficient (R) of 0.750 and weighted average of 18.0%. Similarly, the statistical analysis conducted on geographies consisting of 73,873,422 people shows a strong positive correlation between the proportion of Hopi and unemployment rate among population between the ages 16 and 19 in the United States with a correlation coefficient (R) of 0.747 and weighted average of 30.7%, a difference of 70.6%.
Unemployment Among Ages 16 to 19 years Correlation Summary
| Measurement | South American Indian | Hopi |
| Minimum | 4.5% | 10.2% |
| Maximum | 100.0% | 100.0% |
| Range | 95.5% | 89.8% |
| Mean | 23.1% | 48.0% |
| Median | 17.5% | 27.8% |
| Interquartile 25% (IQ1) | 12.6% | 19.0% |
| Interquartile 75% (IQ3) | 26.5% | 94.5% |
| Interquartile Range (IQR) | 13.9% | 75.4% |
| Standard Deviation (Sample) | 20.1% | 37.4% |
| Standard Deviation (Population) | 19.6% | 35.8% |
Similar Demographics by Unemployment Among Ages 16 to 19 years
Demographics Similar to South American Indians by Unemployment Among Ages 16 to 19 years
In terms of unemployment among ages 16 to 19 years, the demographic groups most similar to South American Indians are Immigrants from Kazakhstan (18.0%, a difference of 0.0%), Immigrants from Syria (18.0%, a difference of 0.040%), Immigrants from Argentina (18.0%, a difference of 0.050%), Immigrants from Morocco (18.0%, a difference of 0.060%), and Chippewa (18.0%, a difference of 0.080%).
| Demographics | Rating | Rank | Unemployment Among Ages 16 to 19 years |
| Carpatho Rusyns | 15.6 /100 | #210 | Poor 17.9% |
| Guamanians/Chamorros | 14.5 /100 | #211 | Poor 17.9% |
| Argentineans | 13.8 /100 | #212 | Poor 18.0% |
| Chippewa | 13.7 /100 | #213 | Poor 18.0% |
| Immigrants | Morocco | 13.5 /100 | #214 | Poor 18.0% |
| Immigrants | Syria | 13.3 /100 | #215 | Poor 18.0% |
| Immigrants | Kazakhstan | 13.0 /100 | #216 | Poor 18.0% |
| South American Indians | 13.0 /100 | #217 | Poor 18.0% |
| Immigrants | Argentina | 12.5 /100 | #218 | Poor 18.0% |
| Immigrants | Africa | 12.0 /100 | #219 | Poor 18.0% |
| Immigrants | Albania | 11.4 /100 | #220 | Poor 18.0% |
| Immigrants | Spain | 11.4 /100 | #221 | Poor 18.0% |
| Immigrants | Iran | 10.7 /100 | #222 | Poor 18.0% |
| Immigrants | Western Asia | 10.2 /100 | #223 | Poor 18.0% |
| Immigrants | Serbia | 8.3 /100 | #224 | Tragic 18.1% |
Demographics Similar to Hopi by Unemployment Among Ages 16 to 19 years
In terms of unemployment among ages 16 to 19 years, the demographic groups most similar to Hopi are Colville (29.7%, a difference of 3.3%), Navajo (29.0%, a difference of 5.6%), Inupiat (28.1%, a difference of 9.3%), Puerto Rican (27.5%, a difference of 11.5%), and Crow (26.2%, a difference of 16.9%).
| Demographics | Rating | Rank | Unemployment Among Ages 16 to 19 years |
| Paiute | 0.0 /100 | #333 | Tragic 24.4% |
| Guyanese | 0.0 /100 | #334 | Tragic 24.8% |
| Arapaho | 0.0 /100 | #335 | Tragic 25.2% |
| Kiowa | 0.0 /100 | #336 | Tragic 25.2% |
| Immigrants | Guyana | 0.0 /100 | #337 | Tragic 25.5% |
| Immigrants | St. Vincent and the Grenadines | 0.0 /100 | #338 | Tragic 25.7% |
| Immigrants | Grenada | 0.0 /100 | #339 | Tragic 25.7% |
| Crow | 0.0 /100 | #340 | Tragic 26.2% |
| Puerto Ricans | 0.0 /100 | #341 | Tragic 27.5% |
| Inupiat | 0.0 /100 | #342 | Tragic 28.1% |
| Navajo | 0.0 /100 | #343 | Tragic 29.0% |
| Colville | 0.0 /100 | #344 | Tragic 29.7% |
| Hopi | 0.0 /100 | #345 | Tragic 30.7% |
| Yuman | 0.0 /100 | #346 | Tragic 37.4% |
| Yup'ik | 0.0 /100 | #347 | Tragic 41.0% |