Tlingit-Haida vs English Unemployment Among Seniors over 65 years
COMPARE
Tlingit-Haida
English
Unemployment Among Seniors over 65 years
Unemployment Among Seniors over 65 years Comparison
Tlingit-Haida
English
6.8%
UNEMPLOYMENT AMONG SENIORS OVER 65 YEARS
0.0/ 100
METRIC RATING
343rd/ 347
METRIC RANK
4.9%
UNEMPLOYMENT AMONG SENIORS OVER 65 YEARS
99.5/ 100
METRIC RATING
66th/ 347
METRIC RANK
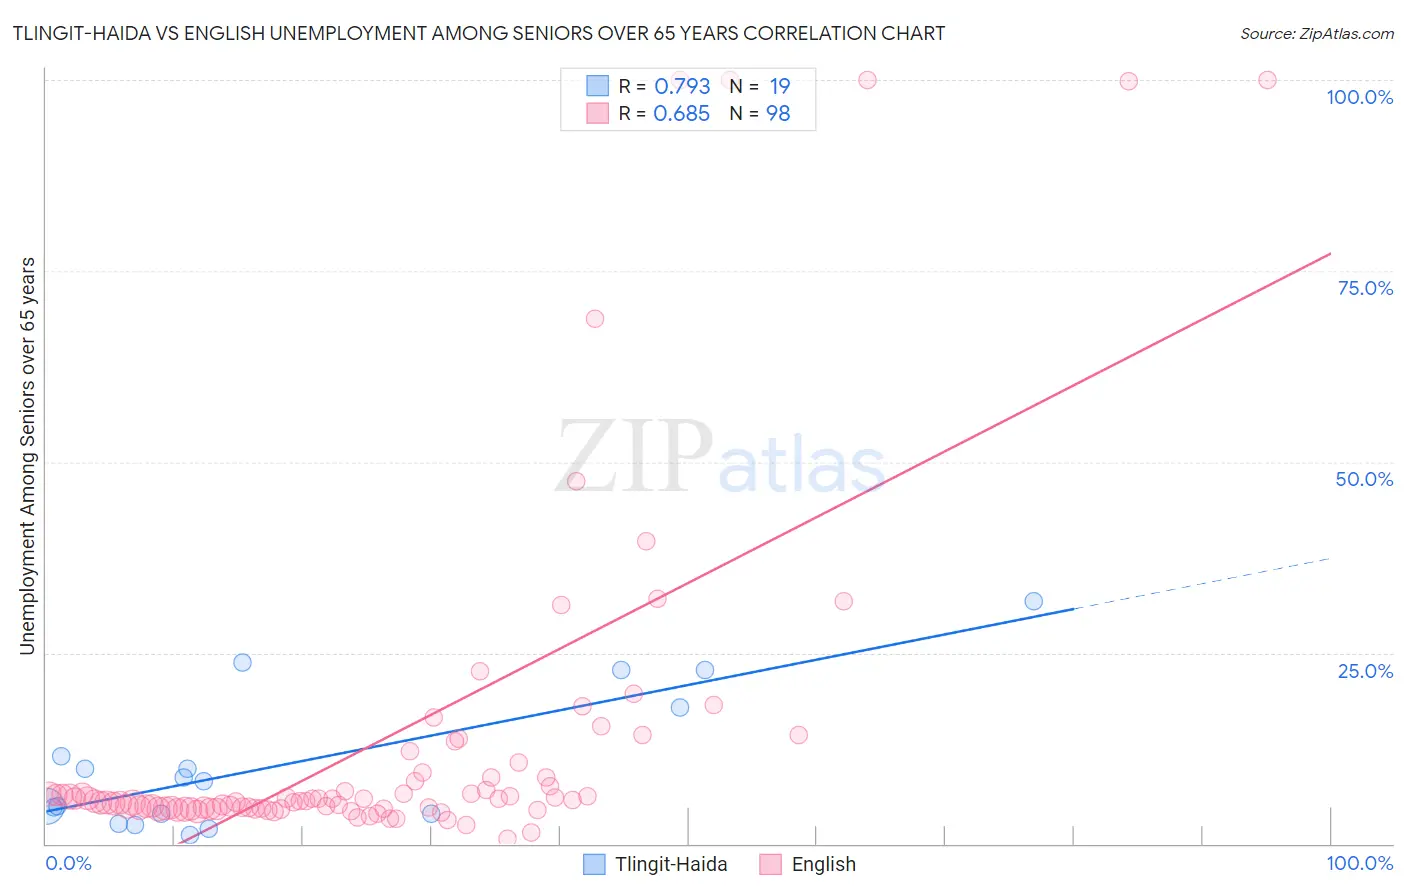
Tlingit-Haida vs English Unemployment Among Seniors over 65 years Correlation Chart
The statistical analysis conducted on geographies consisting of 57,782,692 people shows a strong positive correlation between the proportion of Tlingit-Haida and unemployment rate amomg seniors over the age of 65 in the United States with a correlation coefficient (R) of 0.793 and weighted average of 6.8%. Similarly, the statistical analysis conducted on geographies consisting of 463,344,936 people shows a significant positive correlation between the proportion of English and unemployment rate amomg seniors over the age of 65 in the United States with a correlation coefficient (R) of 0.685 and weighted average of 4.9%, a difference of 37.9%.
Unemployment Among Seniors over 65 years Correlation Summary
| Measurement | Tlingit-Haida | English |
| Minimum | 1.1% | 0.63% |
| Maximum | 31.8% | 100.0% |
| Range | 30.7% | 99.4% |
| Mean | 10.4% | 13.6% |
| Median | 8.2% | 5.7% |
| Interquartile 25% (IQ1) | 3.8% | 4.6% |
| Interquartile 75% (IQ3) | 17.8% | 8.7% |
| Interquartile Range (IQR) | 14.0% | 4.1% |
| Standard Deviation (Sample) | 9.0% | 22.4% |
| Standard Deviation (Population) | 8.8% | 22.3% |
Similar Demographics by Unemployment Among Seniors over 65 years
Demographics Similar to Tlingit-Haida by Unemployment Among Seniors over 65 years
In terms of unemployment among seniors over 65 years, the demographic groups most similar to Tlingit-Haida are Navajo (6.7%, a difference of 1.3%), Yakama (6.7%, a difference of 1.8%), Alaskan Athabascan (7.0%, a difference of 3.8%), Ute (6.3%, a difference of 7.2%), and Paiute (6.3%, a difference of 7.3%).
| Demographics | Rating | Rank | Unemployment Among Seniors over 65 years |
| Immigrants | Dominican Republic | 0.0 /100 | #333 | Tragic 6.0% |
| Tohono O'odham | 0.0 /100 | #334 | Tragic 6.1% |
| Immigrants | Armenia | 0.0 /100 | #335 | Tragic 6.2% |
| Pima | 0.0 /100 | #336 | Tragic 6.3% |
| Alaska Natives | 0.0 /100 | #337 | Tragic 6.3% |
| Immigrants | Azores | 0.0 /100 | #338 | Tragic 6.3% |
| Paiute | 0.0 /100 | #339 | Tragic 6.3% |
| Ute | 0.0 /100 | #340 | Tragic 6.3% |
| Yakama | 0.0 /100 | #341 | Tragic 6.7% |
| Navajo | 0.0 /100 | #342 | Tragic 6.7% |
| Tlingit-Haida | 0.0 /100 | #343 | Tragic 6.8% |
| Alaskan Athabascans | 0.0 /100 | #344 | Tragic 7.0% |
| Immigrants | Yemen | 0.0 /100 | #345 | Tragic 8.2% |
| Yup'ik | 0.0 /100 | #346 | Tragic 9.1% |
| Crow | 0.0 /100 | #347 | Tragic 16.9% |
Demographics Similar to English by Unemployment Among Seniors over 65 years
In terms of unemployment among seniors over 65 years, the demographic groups most similar to English are Iroquois (4.9%, a difference of 0.020%), Immigrants from Nicaragua (4.9%, a difference of 0.050%), Bolivian (4.9%, a difference of 0.060%), Scottish (4.9%, a difference of 0.10%), and Croatian (4.9%, a difference of 0.13%).
| Demographics | Rating | Rank | Unemployment Among Seniors over 65 years |
| Immigrants | Eastern Africa | 99.7 /100 | #59 | Exceptional 4.9% |
| Immigrants | Middle Africa | 99.7 /100 | #60 | Exceptional 4.9% |
| Northern Europeans | 99.7 /100 | #61 | Exceptional 4.9% |
| Latvians | 99.6 /100 | #62 | Exceptional 4.9% |
| Croatians | 99.6 /100 | #63 | Exceptional 4.9% |
| Immigrants | Cambodia | 99.6 /100 | #64 | Exceptional 4.9% |
| Immigrants | Nicaragua | 99.6 /100 | #65 | Exceptional 4.9% |
| English | 99.5 /100 | #66 | Exceptional 4.9% |
| Iroquois | 99.5 /100 | #67 | Exceptional 4.9% |
| Bolivians | 99.5 /100 | #68 | Exceptional 4.9% |
| Scottish | 99.5 /100 | #69 | Exceptional 4.9% |
| Immigrants | Kazakhstan | 99.4 /100 | #70 | Exceptional 4.9% |
| Immigrants | Moldova | 99.4 /100 | #71 | Exceptional 4.9% |
| Nicaraguans | 99.3 /100 | #72 | Exceptional 4.9% |
| Immigrants | Japan | 99.2 /100 | #73 | Exceptional 4.9% |