Thai vs Immigrants from Philippines Male Unemployment
COMPARE
Thai
Immigrants from Philippines
Male Unemployment
Male Unemployment Comparison
Thais
Immigrants from Philippines
4.6%
MALE UNEMPLOYMENT
100.0/ 100
METRIC RATING
9th/ 347
METRIC RANK
5.4%
MALE UNEMPLOYMENT
13.5/ 100
METRIC RATING
201st/ 347
METRIC RANK
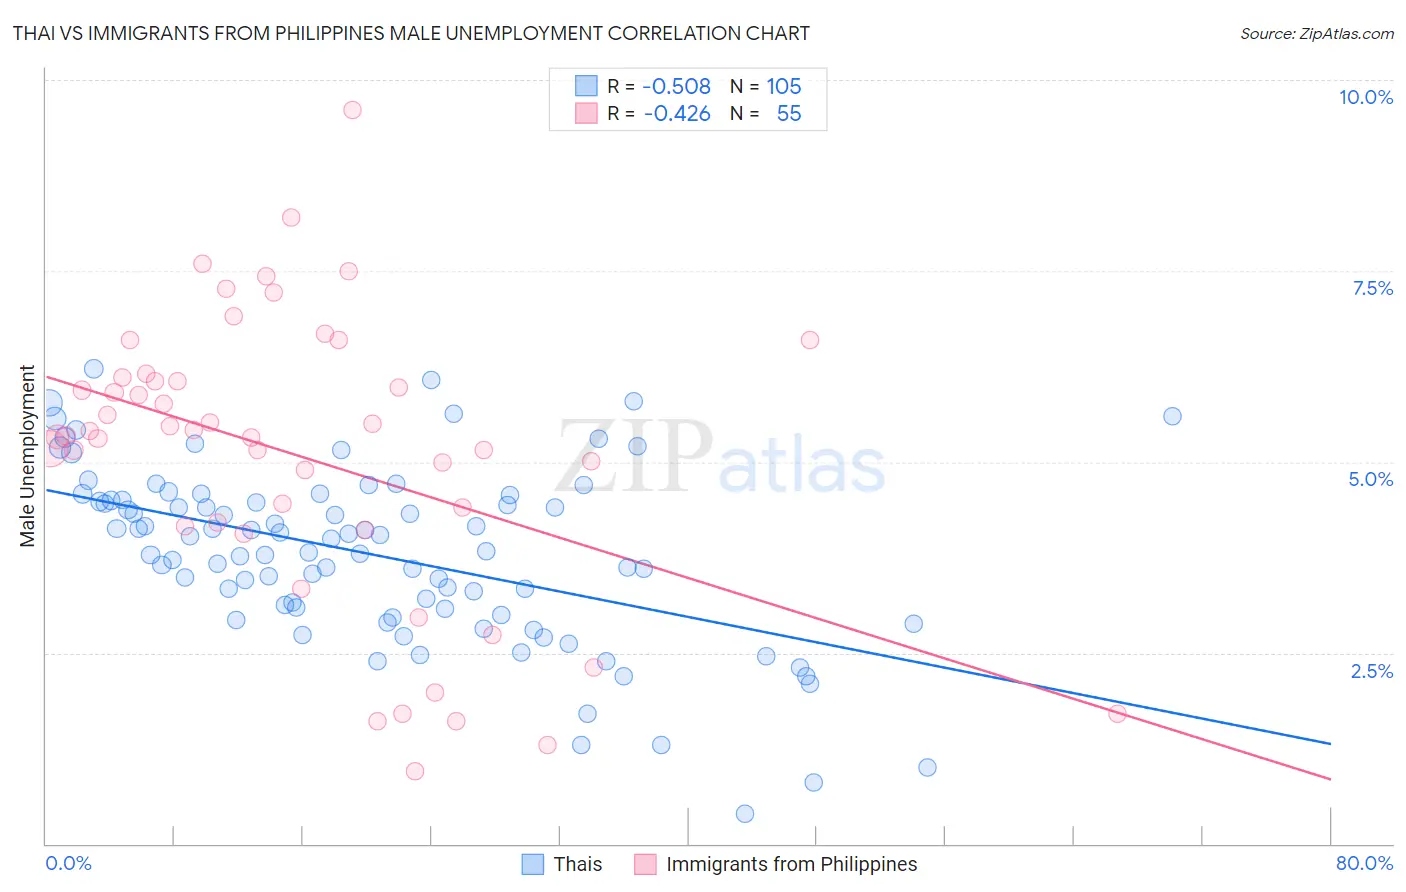
Thai vs Immigrants from Philippines Male Unemployment Correlation Chart
The statistical analysis conducted on geographies consisting of 473,148,308 people shows a substantial negative correlation between the proportion of Thais and unemployment rate among males in the United States with a correlation coefficient (R) of -0.508 and weighted average of 4.6%. Similarly, the statistical analysis conducted on geographies consisting of 468,596,641 people shows a moderate negative correlation between the proportion of Immigrants from Philippines and unemployment rate among males in the United States with a correlation coefficient (R) of -0.426 and weighted average of 5.4%, a difference of 18.5%.
Male Unemployment Correlation Summary
| Measurement | Thai | Immigrants from Philippines |
| Minimum | 0.40% | 0.95% |
| Maximum | 6.2% | 9.6% |
| Range | 5.8% | 8.6% |
| Mean | 3.8% | 5.1% |
| Median | 3.8% | 5.3% |
| Interquartile 25% (IQ1) | 3.0% | 4.2% |
| Interquartile 75% (IQ3) | 4.5% | 6.1% |
| Interquartile Range (IQR) | 1.5% | 1.9% |
| Standard Deviation (Sample) | 1.2% | 1.9% |
| Standard Deviation (Population) | 1.1% | 1.9% |
Similar Demographics by Male Unemployment
Demographics Similar to Thais by Male Unemployment
In terms of male unemployment, the demographic groups most similar to Thais are Cuban (4.6%, a difference of 0.60%), Swedish (4.6%, a difference of 0.81%), Luxembourger (4.5%, a difference of 1.2%), Czech (4.5%, a difference of 1.5%), and Immigrants from Bolivia (4.7%, a difference of 1.5%).
| Demographics | Rating | Rank | Male Unemployment |
| Immigrants | Cuba | 100.0 /100 | #2 | Exceptional 4.4% |
| Norwegians | 100.0 /100 | #3 | Exceptional 4.4% |
| Immigrants | Venezuela | 100.0 /100 | #4 | Exceptional 4.4% |
| Danes | 100.0 /100 | #5 | Exceptional 4.5% |
| Venezuelans | 100.0 /100 | #6 | Exceptional 4.5% |
| Czechs | 100.0 /100 | #7 | Exceptional 4.5% |
| Luxembourgers | 100.0 /100 | #8 | Exceptional 4.5% |
| Thais | 100.0 /100 | #9 | Exceptional 4.6% |
| Cubans | 100.0 /100 | #10 | Exceptional 4.6% |
| Swedes | 100.0 /100 | #11 | Exceptional 4.6% |
| Immigrants | Bolivia | 100.0 /100 | #12 | Exceptional 4.7% |
| Bolivians | 100.0 /100 | #13 | Exceptional 4.7% |
| Germans | 100.0 /100 | #14 | Exceptional 4.7% |
| Scandinavians | 100.0 /100 | #15 | Exceptional 4.7% |
| Swiss | 99.9 /100 | #16 | Exceptional 4.7% |
Demographics Similar to Immigrants from Philippines by Male Unemployment
In terms of male unemployment, the demographic groups most similar to Immigrants from Philippines are Immigrants from Zaire (5.4%, a difference of 0.020%), Nonimmigrants (5.4%, a difference of 0.040%), Immigrants from Laos (5.4%, a difference of 0.050%), Immigrants from Greece (5.4%, a difference of 0.12%), and Immigrants from Thailand (5.4%, a difference of 0.15%).
| Demographics | Rating | Rank | Male Unemployment |
| Spanish | 19.7 /100 | #194 | Poor 5.4% |
| Immigrants | Southern Europe | 17.7 /100 | #195 | Poor 5.4% |
| Albanians | 17.3 /100 | #196 | Poor 5.4% |
| Alsatians | 16.7 /100 | #197 | Poor 5.4% |
| Immigrants | Thailand | 14.7 /100 | #198 | Poor 5.4% |
| Immigrants | Greece | 14.5 /100 | #199 | Poor 5.4% |
| Immigrants | Zaire | 13.7 /100 | #200 | Poor 5.4% |
| Immigrants | Philippines | 13.5 /100 | #201 | Poor 5.4% |
| Immigrants | Nonimmigrants | 13.1 /100 | #202 | Poor 5.4% |
| Immigrants | Laos | 13.0 /100 | #203 | Poor 5.4% |
| Guamanians/Chamorros | 12.3 /100 | #204 | Poor 5.4% |
| Immigrants | Costa Rica | 11.4 /100 | #205 | Poor 5.5% |
| Immigrants | Ukraine | 9.9 /100 | #206 | Tragic 5.5% |
| Immigrants | Syria | 9.3 /100 | #207 | Tragic 5.5% |
| Immigrants | Lebanon | 8.6 /100 | #208 | Tragic 5.5% |