Serbian vs Ecuadorian Male Unemployment
COMPARE
Serbian
Ecuadorian
Male Unemployment
Male Unemployment Comparison
Serbians
Ecuadorians
5.1%
MALE UNEMPLOYMENT
95.7/ 100
METRIC RATING
84th/ 347
METRIC RANK
6.2%
MALE UNEMPLOYMENT
0.0/ 100
METRIC RATING
282nd/ 347
METRIC RANK
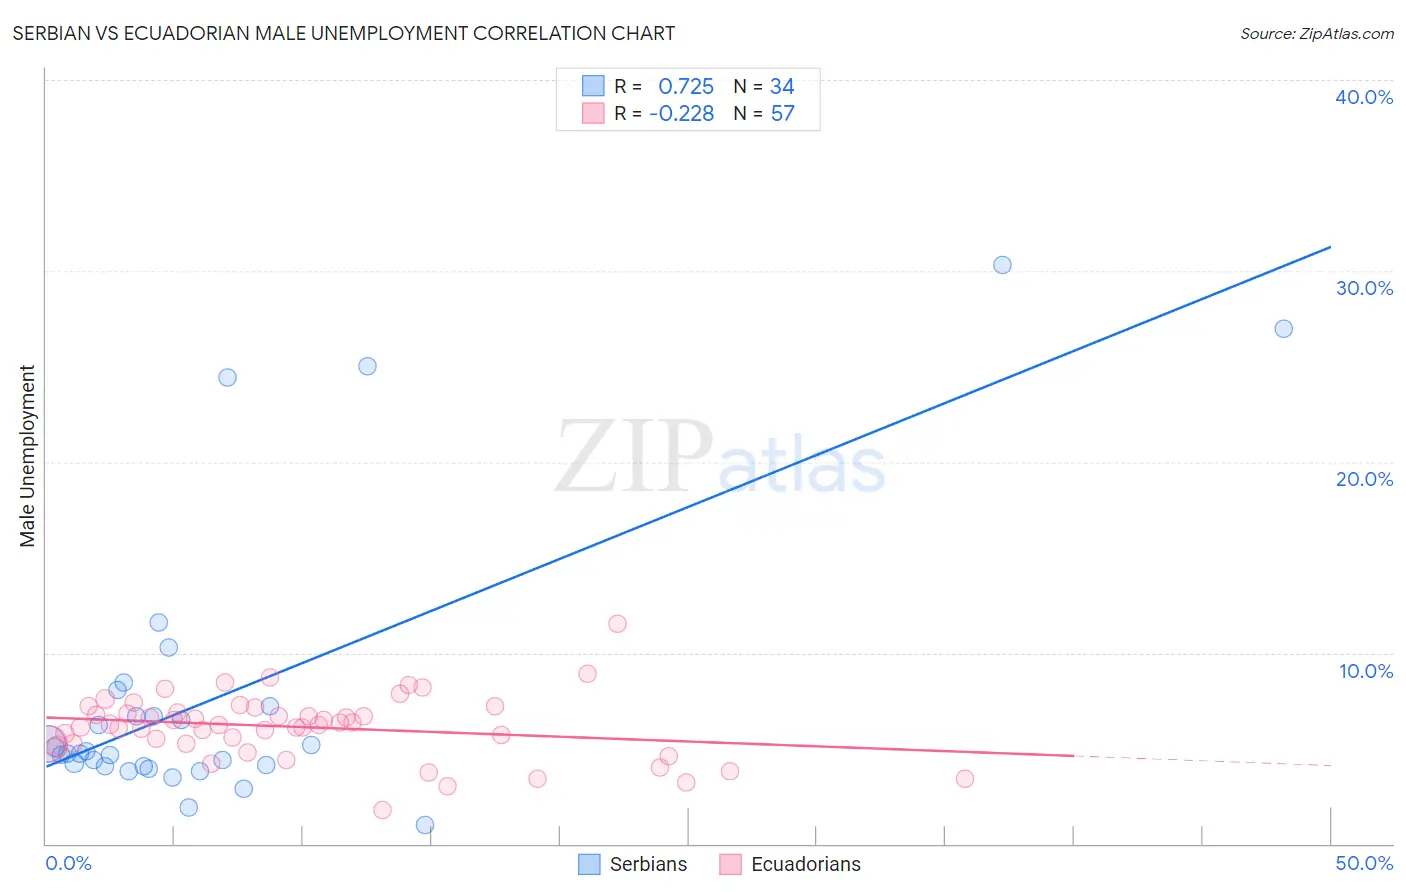
Serbian vs Ecuadorian Male Unemployment Correlation Chart
The statistical analysis conducted on geographies consisting of 266,907,667 people shows a strong positive correlation between the proportion of Serbians and unemployment rate among males in the United States with a correlation coefficient (R) of 0.725 and weighted average of 5.1%. Similarly, the statistical analysis conducted on geographies consisting of 317,005,514 people shows a weak negative correlation between the proportion of Ecuadorians and unemployment rate among males in the United States with a correlation coefficient (R) of -0.228 and weighted average of 6.2%, a difference of 22.4%.
Male Unemployment Correlation Summary
| Measurement | Serbian | Ecuadorian |
| Minimum | 1.0% | 1.7% |
| Maximum | 30.3% | 11.5% |
| Range | 29.3% | 9.8% |
| Mean | 7.7% | 6.1% |
| Median | 4.8% | 6.2% |
| Interquartile 25% (IQ1) | 4.1% | 5.2% |
| Interquartile 75% (IQ3) | 7.2% | 7.0% |
| Interquartile Range (IQR) | 3.1% | 1.8% |
| Standard Deviation (Sample) | 7.4% | 1.7% |
| Standard Deviation (Population) | 7.3% | 1.7% |
Similar Demographics by Male Unemployment
Demographics Similar to Serbians by Male Unemployment
In terms of male unemployment, the demographic groups most similar to Serbians are Immigrants from North Macedonia (5.1%, a difference of 0.050%), Maltese (5.1%, a difference of 0.090%), Immigrants from Romania (5.1%, a difference of 0.11%), Immigrants from Eritrea (5.0%, a difference of 0.12%), and Chilean (5.0%, a difference of 0.17%).
| Demographics | Rating | Rank | Male Unemployment |
| Iranians | 96.4 /100 | #77 | Exceptional 5.0% |
| Immigrants | Northern Europe | 96.4 /100 | #78 | Exceptional 5.0% |
| South Africans | 96.4 /100 | #79 | Exceptional 5.0% |
| Argentineans | 96.2 /100 | #80 | Exceptional 5.0% |
| French | 96.2 /100 | #81 | Exceptional 5.0% |
| Chileans | 96.2 /100 | #82 | Exceptional 5.0% |
| Immigrants | Eritrea | 96.0 /100 | #83 | Exceptional 5.0% |
| Serbians | 95.7 /100 | #84 | Exceptional 5.1% |
| Immigrants | North Macedonia | 95.6 /100 | #85 | Exceptional 5.1% |
| Maltese | 95.5 /100 | #86 | Exceptional 5.1% |
| Immigrants | Romania | 95.4 /100 | #87 | Exceptional 5.1% |
| Immigrants | Sri Lanka | 94.9 /100 | #88 | Exceptional 5.1% |
| Immigrants | Australia | 94.7 /100 | #89 | Exceptional 5.1% |
| Okinawans | 94.7 /100 | #90 | Exceptional 5.1% |
| Immigrants | Turkey | 94.4 /100 | #91 | Exceptional 5.1% |
Demographics Similar to Ecuadorians by Male Unemployment
In terms of male unemployment, the demographic groups most similar to Ecuadorians are Immigrants from Western Africa (6.2%, a difference of 0.030%), Sierra Leonean (6.2%, a difference of 0.43%), Immigrants from Ghana (6.2%, a difference of 0.50%), Spanish American Indian (6.2%, a difference of 0.68%), and Immigrants from Ecuador (6.2%, a difference of 0.70%).
| Demographics | Rating | Rank | Male Unemployment |
| Menominee | 0.0 /100 | #275 | Tragic 6.0% |
| Tlingit-Haida | 0.0 /100 | #276 | Tragic 6.0% |
| Immigrants | Liberia | 0.0 /100 | #277 | Tragic 6.1% |
| Immigrants | Fiji | 0.0 /100 | #278 | Tragic 6.1% |
| Ghanaians | 0.0 /100 | #279 | Tragic 6.1% |
| Immigrants | Ghana | 0.0 /100 | #280 | Tragic 6.2% |
| Sierra Leoneans | 0.0 /100 | #281 | Tragic 6.2% |
| Ecuadorians | 0.0 /100 | #282 | Tragic 6.2% |
| Immigrants | Western Africa | 0.0 /100 | #283 | Tragic 6.2% |
| Spanish American Indians | 0.0 /100 | #284 | Tragic 6.2% |
| Immigrants | Ecuador | 0.0 /100 | #285 | Tragic 6.2% |
| Africans | 0.0 /100 | #286 | Tragic 6.3% |
| Central American Indians | 0.0 /100 | #287 | Tragic 6.3% |
| Immigrants | Senegal | 0.0 /100 | #288 | Tragic 6.3% |
| Immigrants | Caribbean | 0.0 /100 | #289 | Tragic 6.3% |