New Zealander vs Ecuadorian Male Unemployment
COMPARE
New Zealander
Ecuadorian
Male Unemployment
Male Unemployment Comparison
New Zealanders
Ecuadorians
5.0%
MALE UNEMPLOYMENT
97.3/ 100
METRIC RATING
71st/ 347
METRIC RANK
6.2%
MALE UNEMPLOYMENT
0.0/ 100
METRIC RATING
282nd/ 347
METRIC RANK
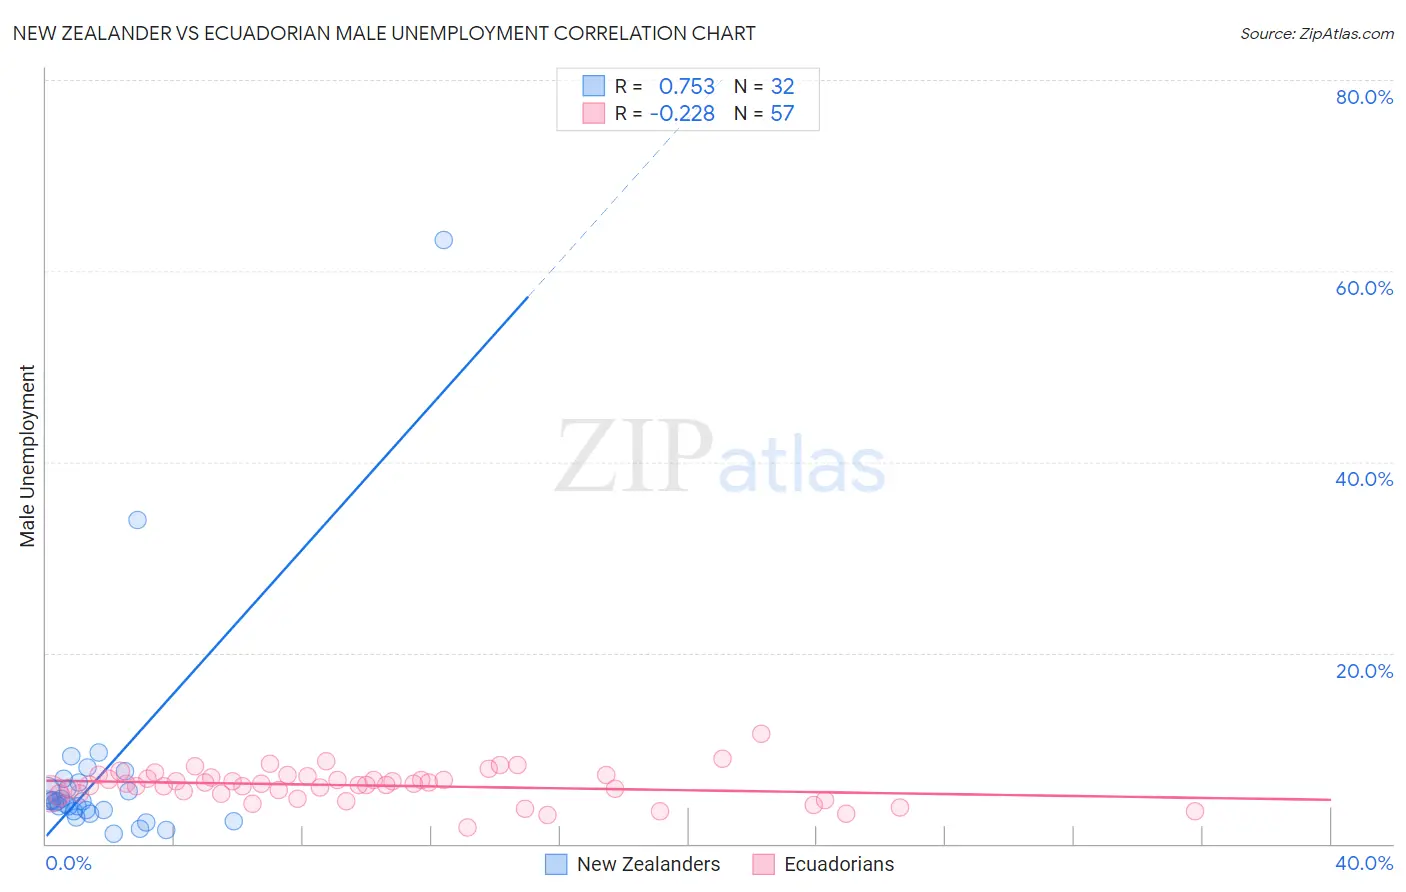
New Zealander vs Ecuadorian Male Unemployment Correlation Chart
The statistical analysis conducted on geographies consisting of 106,769,284 people shows a strong positive correlation between the proportion of New Zealanders and unemployment rate among males in the United States with a correlation coefficient (R) of 0.753 and weighted average of 5.0%. Similarly, the statistical analysis conducted on geographies consisting of 317,005,514 people shows a weak negative correlation between the proportion of Ecuadorians and unemployment rate among males in the United States with a correlation coefficient (R) of -0.228 and weighted average of 6.2%, a difference of 23.2%.
Male Unemployment Correlation Summary
| Measurement | New Zealander | Ecuadorian |
| Minimum | 1.1% | 1.7% |
| Maximum | 63.2% | 11.5% |
| Range | 62.1% | 9.8% |
| Mean | 7.3% | 6.1% |
| Median | 4.4% | 6.2% |
| Interquartile 25% (IQ1) | 3.5% | 5.2% |
| Interquartile 75% (IQ3) | 6.1% | 7.0% |
| Interquartile Range (IQR) | 2.6% | 1.8% |
| Standard Deviation (Sample) | 11.6% | 1.7% |
| Standard Deviation (Population) | 11.4% | 1.7% |
Similar Demographics by Male Unemployment
Demographics Similar to New Zealanders by Male Unemployment
In terms of male unemployment, the demographic groups most similar to New Zealanders are White/Caucasian (5.0%, a difference of 0.020%), Immigrants from Sweden (5.0%, a difference of 0.070%), Immigrants from South Africa (5.0%, a difference of 0.070%), Australian (5.0%, a difference of 0.10%), and Immigrants from Canada (5.0%, a difference of 0.11%).
| Demographics | Rating | Rank | Male Unemployment |
| Celtics | 97.8 /100 | #64 | Exceptional 5.0% |
| Icelanders | 97.6 /100 | #65 | Exceptional 5.0% |
| Finns | 97.5 /100 | #66 | Exceptional 5.0% |
| Immigrants | Canada | 97.5 /100 | #67 | Exceptional 5.0% |
| Australians | 97.4 /100 | #68 | Exceptional 5.0% |
| Immigrants | Sweden | 97.4 /100 | #69 | Exceptional 5.0% |
| Whites/Caucasians | 97.3 /100 | #70 | Exceptional 5.0% |
| New Zealanders | 97.3 /100 | #71 | Exceptional 5.0% |
| Immigrants | South Africa | 97.1 /100 | #72 | Exceptional 5.0% |
| Greeks | 97.0 /100 | #73 | Exceptional 5.0% |
| Immigrants | North America | 96.9 /100 | #74 | Exceptional 5.0% |
| Assyrians/Chaldeans/Syriacs | 96.9 /100 | #75 | Exceptional 5.0% |
| Immigrants | Sudan | 96.5 /100 | #76 | Exceptional 5.0% |
| Iranians | 96.4 /100 | #77 | Exceptional 5.0% |
| Immigrants | Northern Europe | 96.4 /100 | #78 | Exceptional 5.0% |
Demographics Similar to Ecuadorians by Male Unemployment
In terms of male unemployment, the demographic groups most similar to Ecuadorians are Immigrants from Western Africa (6.2%, a difference of 0.030%), Sierra Leonean (6.2%, a difference of 0.43%), Immigrants from Ghana (6.2%, a difference of 0.50%), Spanish American Indian (6.2%, a difference of 0.68%), and Immigrants from Ecuador (6.2%, a difference of 0.70%).
| Demographics | Rating | Rank | Male Unemployment |
| Menominee | 0.0 /100 | #275 | Tragic 6.0% |
| Tlingit-Haida | 0.0 /100 | #276 | Tragic 6.0% |
| Immigrants | Liberia | 0.0 /100 | #277 | Tragic 6.1% |
| Immigrants | Fiji | 0.0 /100 | #278 | Tragic 6.1% |
| Ghanaians | 0.0 /100 | #279 | Tragic 6.1% |
| Immigrants | Ghana | 0.0 /100 | #280 | Tragic 6.2% |
| Sierra Leoneans | 0.0 /100 | #281 | Tragic 6.2% |
| Ecuadorians | 0.0 /100 | #282 | Tragic 6.2% |
| Immigrants | Western Africa | 0.0 /100 | #283 | Tragic 6.2% |
| Spanish American Indians | 0.0 /100 | #284 | Tragic 6.2% |
| Immigrants | Ecuador | 0.0 /100 | #285 | Tragic 6.2% |
| Africans | 0.0 /100 | #286 | Tragic 6.3% |
| Central American Indians | 0.0 /100 | #287 | Tragic 6.3% |
| Immigrants | Senegal | 0.0 /100 | #288 | Tragic 6.3% |
| Immigrants | Caribbean | 0.0 /100 | #289 | Tragic 6.3% |