Immigrants from Caribbean vs Puget Sound Salish Unemployment
COMPARE
Immigrants from Caribbean
Puget Sound Salish
Unemployment
Unemployment Comparison
Immigrants from Caribbean
Puget Sound Salish
6.2%
UNEMPLOYMENT
0.0/ 100
METRIC RATING
286th/ 347
METRIC RANK
5.2%
UNEMPLOYMENT
56.6/ 100
METRIC RATING
171st/ 347
METRIC RANK
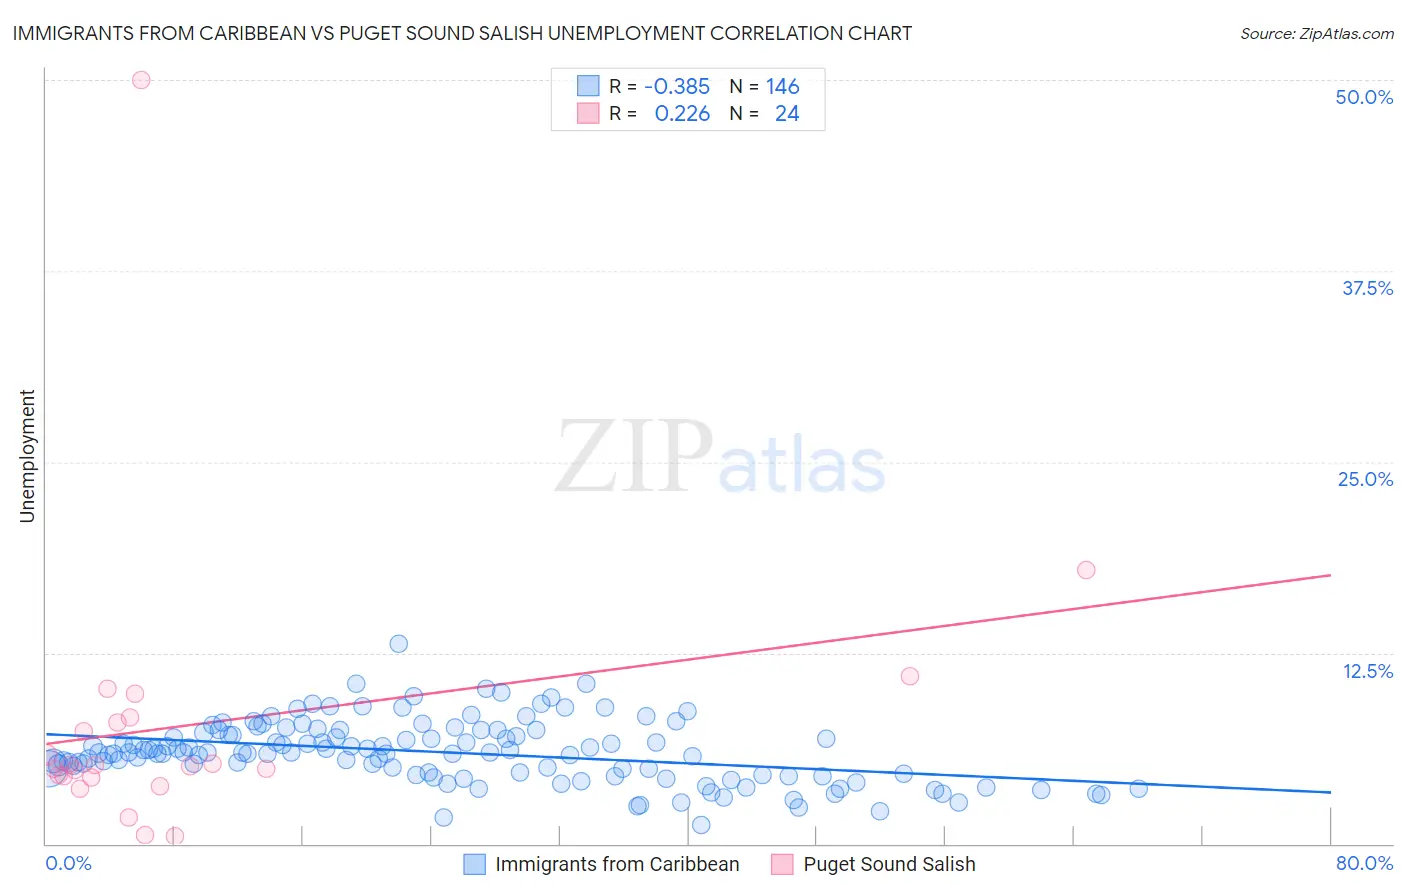
Immigrants from Caribbean vs Puget Sound Salish Unemployment Correlation Chart
The statistical analysis conducted on geographies consisting of 449,366,632 people shows a mild negative correlation between the proportion of Immigrants from Caribbean and unemployment in the United States with a correlation coefficient (R) of -0.385 and weighted average of 6.2%. Similarly, the statistical analysis conducted on geographies consisting of 46,125,873 people shows a weak positive correlation between the proportion of Puget Sound Salish and unemployment in the United States with a correlation coefficient (R) of 0.226 and weighted average of 5.2%, a difference of 17.5%.
Unemployment Correlation Summary
| Measurement | Immigrants from Caribbean | Puget Sound Salish |
| Minimum | 1.2% | 0.50% |
| Maximum | 13.1% | 50.0% |
| Range | 11.9% | 49.5% |
| Mean | 6.0% | 7.8% |
| Median | 6.0% | 5.1% |
| Interquartile 25% (IQ1) | 4.6% | 4.4% |
| Interquartile 75% (IQ3) | 7.3% | 8.1% |
| Interquartile Range (IQR) | 2.7% | 3.7% |
| Standard Deviation (Sample) | 2.0% | 9.7% |
| Standard Deviation (Population) | 2.0% | 9.5% |
Similar Demographics by Unemployment
Demographics Similar to Immigrants from Caribbean by Unemployment
In terms of unemployment, the demographic groups most similar to Immigrants from Caribbean are Nepalese (6.2%, a difference of 0.33%), Ecuadorian (6.2%, a difference of 0.36%), Immigrants from Senegal (6.1%, a difference of 0.43%), Chippewa (6.2%, a difference of 0.71%), and Senegalese (6.2%, a difference of 0.80%).
| Demographics | Rating | Rank | Unemployment |
| Immigrants | Mexico | 0.0 /100 | #279 | Tragic 6.0% |
| Immigrants | Western Africa | 0.0 /100 | #280 | Tragic 6.0% |
| Africans | 0.0 /100 | #281 | Tragic 6.1% |
| Immigrants | Azores | 0.0 /100 | #282 | Tragic 6.1% |
| Immigrants | Ghana | 0.0 /100 | #283 | Tragic 6.1% |
| Aleuts | 0.0 /100 | #284 | Tragic 6.1% |
| Immigrants | Senegal | 0.0 /100 | #285 | Tragic 6.1% |
| Immigrants | Caribbean | 0.0 /100 | #286 | Tragic 6.2% |
| Nepalese | 0.0 /100 | #287 | Tragic 6.2% |
| Ecuadorians | 0.0 /100 | #288 | Tragic 6.2% |
| Chippewa | 0.0 /100 | #289 | Tragic 6.2% |
| Senegalese | 0.0 /100 | #290 | Tragic 6.2% |
| Haitians | 0.0 /100 | #291 | Tragic 6.2% |
| Central American Indians | 0.0 /100 | #292 | Tragic 6.2% |
| Immigrants | Ecuador | 0.0 /100 | #293 | Tragic 6.2% |
Demographics Similar to Puget Sound Salish by Unemployment
In terms of unemployment, the demographic groups most similar to Puget Sound Salish are Immigrants from Nicaragua (5.2%, a difference of 0.040%), Immigrants from Morocco (5.2%, a difference of 0.16%), Uruguayan (5.2%, a difference of 0.23%), Immigrants from Vietnam (5.2%, a difference of 0.25%), and Immigrants from Indonesia (5.2%, a difference of 0.29%).
| Demographics | Rating | Rank | Unemployment |
| Immigrants | Colombia | 64.7 /100 | #164 | Good 5.2% |
| Immigrants | Brazil | 63.1 /100 | #165 | Good 5.2% |
| Immigrants | Indonesia | 61.2 /100 | #166 | Good 5.2% |
| Colombians | 61.1 /100 | #167 | Good 5.2% |
| Uruguayans | 60.2 /100 | #168 | Good 5.2% |
| Immigrants | Morocco | 59.1 /100 | #169 | Average 5.2% |
| Immigrants | Nicaragua | 57.1 /100 | #170 | Average 5.2% |
| Puget Sound Salish | 56.6 /100 | #171 | Average 5.2% |
| Immigrants | Vietnam | 52.5 /100 | #172 | Average 5.2% |
| Immigrants | Poland | 51.8 /100 | #173 | Average 5.3% |
| Immigrants | Congo | 50.0 /100 | #174 | Average 5.3% |
| Taiwanese | 49.6 /100 | #175 | Average 5.3% |
| Nicaraguans | 48.7 /100 | #176 | Average 5.3% |
| Immigrants | Nonimmigrants | 47.9 /100 | #177 | Average 5.3% |
| Afghans | 47.4 /100 | #178 | Average 5.3% |