Immigrants from Syria vs Puget Sound Salish Unemployment
COMPARE
Immigrants from Syria
Puget Sound Salish
Unemployment
Unemployment Comparison
Immigrants from Syria
Puget Sound Salish
5.5%
UNEMPLOYMENT
4.8/ 100
METRIC RATING
233rd/ 347
METRIC RANK
5.2%
UNEMPLOYMENT
56.6/ 100
METRIC RATING
171st/ 347
METRIC RANK
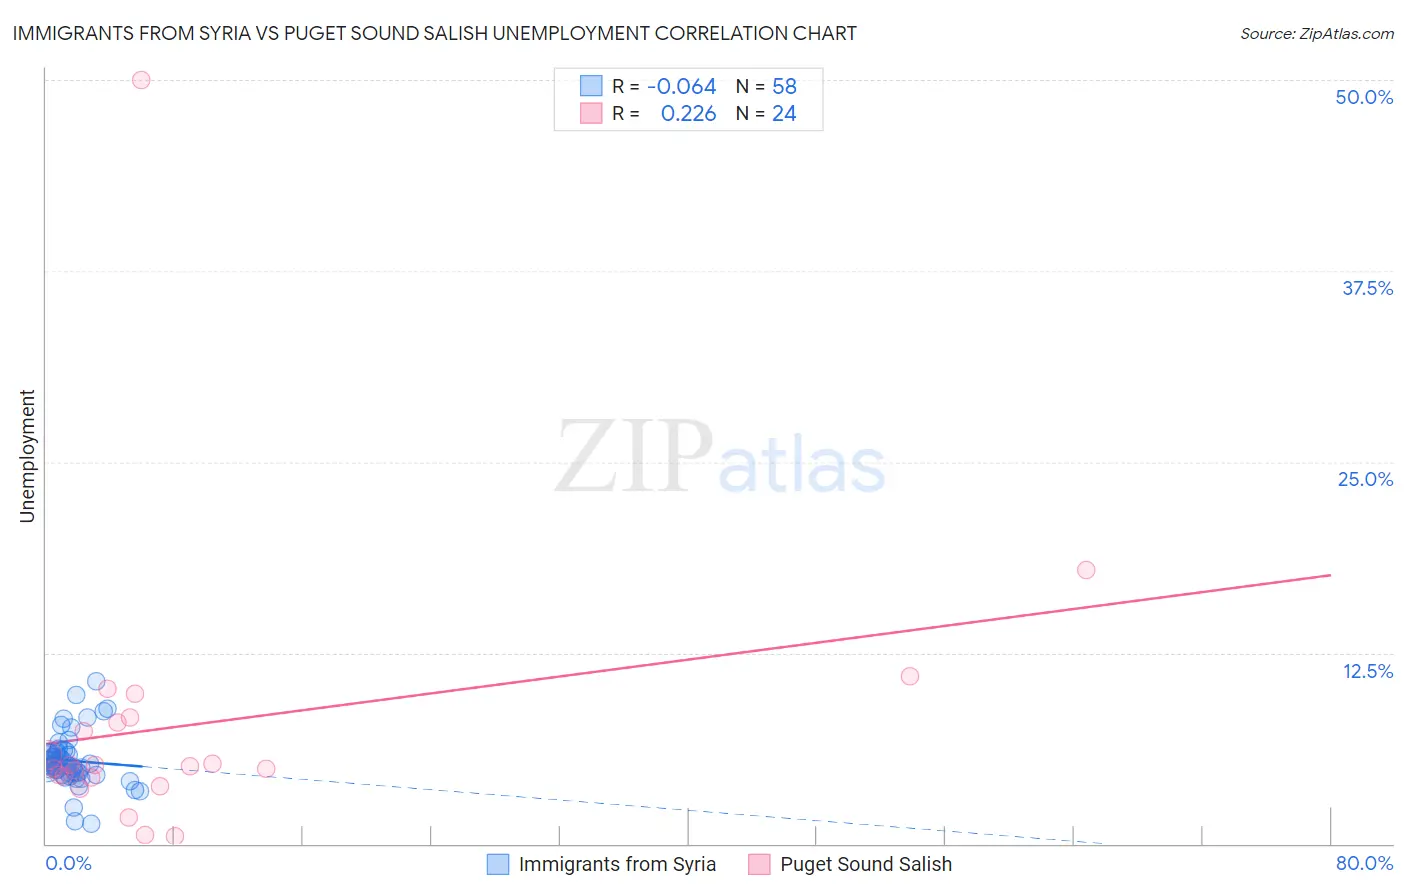
Immigrants from Syria vs Puget Sound Salish Unemployment Correlation Chart
The statistical analysis conducted on geographies consisting of 173,974,388 people shows a slight negative correlation between the proportion of Immigrants from Syria and unemployment in the United States with a correlation coefficient (R) of -0.064 and weighted average of 5.5%. Similarly, the statistical analysis conducted on geographies consisting of 46,125,873 people shows a weak positive correlation between the proportion of Puget Sound Salish and unemployment in the United States with a correlation coefficient (R) of 0.226 and weighted average of 5.2%, a difference of 5.0%.
Unemployment Correlation Summary
| Measurement | Immigrants from Syria | Puget Sound Salish |
| Minimum | 1.3% | 0.50% |
| Maximum | 10.6% | 50.0% |
| Range | 9.3% | 49.5% |
| Mean | 5.4% | 7.8% |
| Median | 5.2% | 5.1% |
| Interquartile 25% (IQ1) | 4.7% | 4.4% |
| Interquartile 75% (IQ3) | 5.9% | 8.1% |
| Interquartile Range (IQR) | 1.2% | 3.7% |
| Standard Deviation (Sample) | 1.7% | 9.7% |
| Standard Deviation (Population) | 1.7% | 9.5% |
Similar Demographics by Unemployment
Demographics Similar to Immigrants from Syria by Unemployment
In terms of unemployment, the demographic groups most similar to Immigrants from Syria are Panamanian (5.5%, a difference of 0.030%), Immigrants from Africa (5.5%, a difference of 0.050%), Comanche (5.5%, a difference of 0.050%), Hawaiian (5.5%, a difference of 0.18%), and Ottawa (5.5%, a difference of 0.18%).
| Demographics | Rating | Rank | Unemployment |
| Samoans | 7.1 /100 | #226 | Tragic 5.5% |
| Immigrants | Lebanon | 7.0 /100 | #227 | Tragic 5.5% |
| Guamanians/Chamorros | 6.3 /100 | #228 | Tragic 5.5% |
| Hawaiians | 5.4 /100 | #229 | Tragic 5.5% |
| Ottawa | 5.4 /100 | #230 | Tragic 5.5% |
| Immigrants | Africa | 4.9 /100 | #231 | Tragic 5.5% |
| Comanche | 4.9 /100 | #232 | Tragic 5.5% |
| Immigrants | Syria | 4.8 /100 | #233 | Tragic 5.5% |
| Panamanians | 4.7 /100 | #234 | Tragic 5.5% |
| Immigrants | Panama | 3.4 /100 | #235 | Tragic 5.5% |
| Immigrants | Cambodia | 3.3 /100 | #236 | Tragic 5.5% |
| Moroccans | 3.2 /100 | #237 | Tragic 5.5% |
| Immigrants | Western Asia | 2.8 /100 | #238 | Tragic 5.5% |
| Immigrants | Immigrants | 2.6 /100 | #239 | Tragic 5.5% |
| Cree | 2.6 /100 | #240 | Tragic 5.6% |
Demographics Similar to Puget Sound Salish by Unemployment
In terms of unemployment, the demographic groups most similar to Puget Sound Salish are Immigrants from Nicaragua (5.2%, a difference of 0.040%), Immigrants from Morocco (5.2%, a difference of 0.16%), Uruguayan (5.2%, a difference of 0.23%), Immigrants from Vietnam (5.2%, a difference of 0.25%), and Immigrants from Indonesia (5.2%, a difference of 0.29%).
| Demographics | Rating | Rank | Unemployment |
| Immigrants | Colombia | 64.7 /100 | #164 | Good 5.2% |
| Immigrants | Brazil | 63.1 /100 | #165 | Good 5.2% |
| Immigrants | Indonesia | 61.2 /100 | #166 | Good 5.2% |
| Colombians | 61.1 /100 | #167 | Good 5.2% |
| Uruguayans | 60.2 /100 | #168 | Good 5.2% |
| Immigrants | Morocco | 59.1 /100 | #169 | Average 5.2% |
| Immigrants | Nicaragua | 57.1 /100 | #170 | Average 5.2% |
| Puget Sound Salish | 56.6 /100 | #171 | Average 5.2% |
| Immigrants | Vietnam | 52.5 /100 | #172 | Average 5.2% |
| Immigrants | Poland | 51.8 /100 | #173 | Average 5.3% |
| Immigrants | Congo | 50.0 /100 | #174 | Average 5.3% |
| Taiwanese | 49.6 /100 | #175 | Average 5.3% |
| Nicaraguans | 48.7 /100 | #176 | Average 5.3% |
| Immigrants | Nonimmigrants | 47.9 /100 | #177 | Average 5.3% |
| Afghans | 47.4 /100 | #178 | Average 5.3% |