Subsaharan African vs Barbadian Unemployment Among Seniors over 75 years
COMPARE
Subsaharan African
Barbadian
Unemployment Among Seniors over 75 years
Unemployment Among Seniors over 75 years Comparison
Sub-Saharan Africans
Barbadians
9.2%
UNEMPLOYMENT AMONG SENIORS OVER 75 YEARS
2.3/ 100
METRIC RATING
247th/ 347
METRIC RANK
8.5%
UNEMPLOYMENT AMONG SENIORS OVER 75 YEARS
88.6/ 100
METRIC RATING
139th/ 347
METRIC RANK
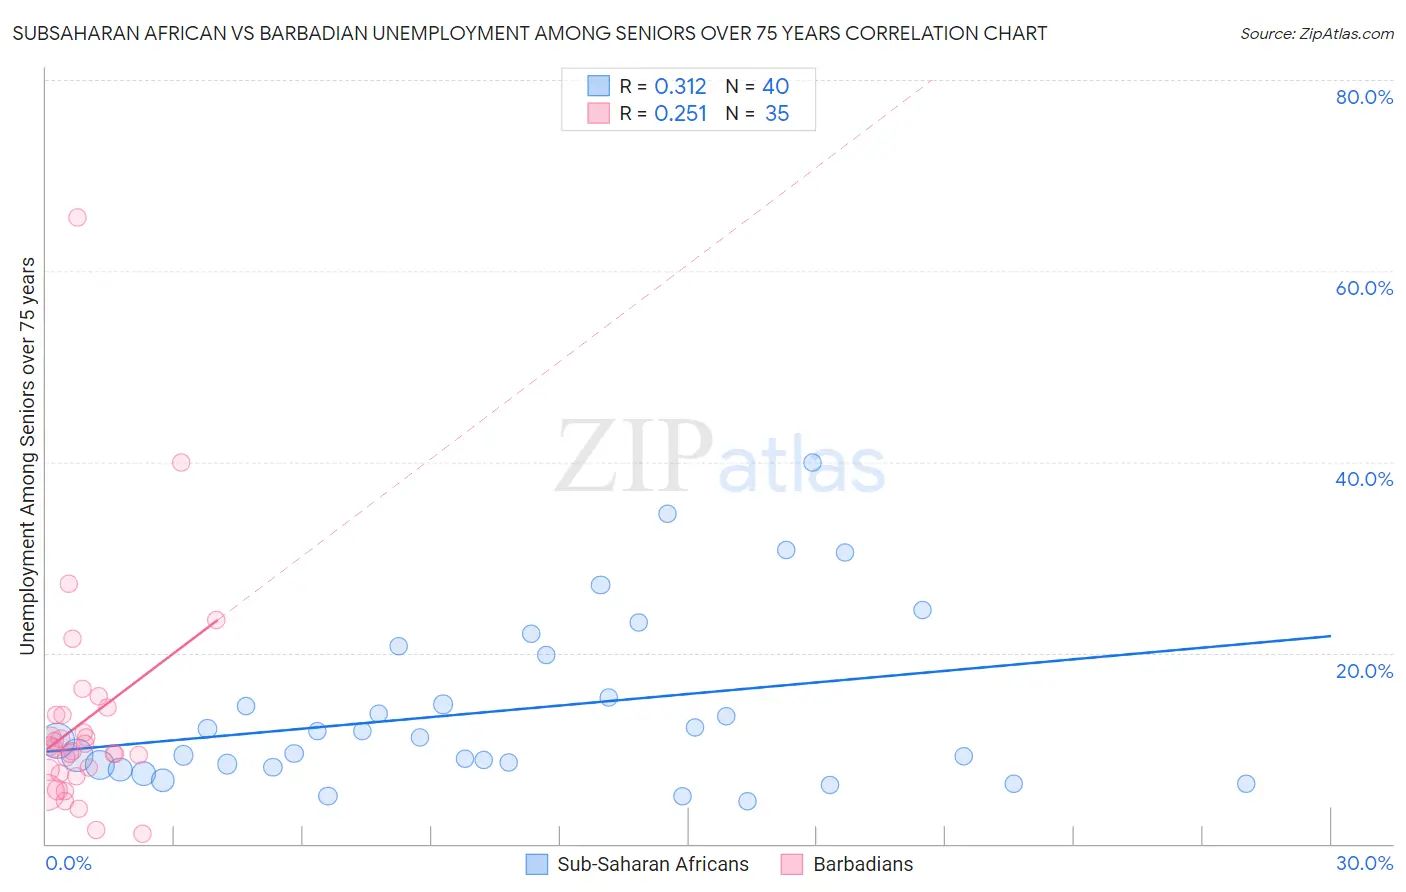
Subsaharan African vs Barbadian Unemployment Among Seniors over 75 years Correlation Chart
The statistical analysis conducted on geographies consisting of 227,990,978 people shows a mild positive correlation between the proportion of Sub-Saharan Africans and unemployment rate among seniors over the age of 75 in the United States with a correlation coefficient (R) of 0.312 and weighted average of 9.2%. Similarly, the statistical analysis conducted on geographies consisting of 99,705,389 people shows a weak positive correlation between the proportion of Barbadians and unemployment rate among seniors over the age of 75 in the United States with a correlation coefficient (R) of 0.251 and weighted average of 8.5%, a difference of 8.0%.
Unemployment Among Seniors over 75 years Correlation Summary
| Measurement | Subsaharan African | Barbadian |
| Minimum | 4.4% | 1.0% |
| Maximum | 40.0% | 65.6% |
| Range | 35.6% | 64.6% |
| Mean | 13.9% | 12.9% |
| Median | 10.9% | 10.0% |
| Interquartile 25% (IQ1) | 8.2% | 7.4% |
| Interquartile 75% (IQ3) | 17.5% | 13.5% |
| Interquartile Range (IQR) | 9.4% | 6.1% |
| Standard Deviation (Sample) | 8.8% | 11.8% |
| Standard Deviation (Population) | 8.7% | 11.6% |
Similar Demographics by Unemployment Among Seniors over 75 years
Demographics Similar to Sub-Saharan Africans by Unemployment Among Seniors over 75 years
In terms of unemployment among seniors over 75 years, the demographic groups most similar to Sub-Saharan Africans are Immigrants from North America (9.2%, a difference of 0.020%), Blackfeet (9.2%, a difference of 0.040%), Immigrants from Saudi Arabia (9.2%, a difference of 0.090%), Central American Indian (9.2%, a difference of 0.10%), and Immigrants from Canada (9.2%, a difference of 0.14%).
| Demographics | Rating | Rank | Unemployment Among Seniors over 75 years |
| Spanish | 3.3 /100 | #240 | Tragic 9.1% |
| Immigrants | Southern Europe | 2.8 /100 | #241 | Tragic 9.2% |
| Sierra Leoneans | 2.8 /100 | #242 | Tragic 9.2% |
| Slavs | 2.8 /100 | #243 | Tragic 9.2% |
| Immigrants | Germany | 2.7 /100 | #244 | Tragic 9.2% |
| Immigrants | Canada | 2.6 /100 | #245 | Tragic 9.2% |
| Immigrants | North America | 2.4 /100 | #246 | Tragic 9.2% |
| Sub-Saharan Africans | 2.3 /100 | #247 | Tragic 9.2% |
| Blackfeet | 2.3 /100 | #248 | Tragic 9.2% |
| Immigrants | Saudi Arabia | 2.2 /100 | #249 | Tragic 9.2% |
| Central American Indians | 2.2 /100 | #250 | Tragic 9.2% |
| Immigrants | Poland | 2.0 /100 | #251 | Tragic 9.2% |
| Immigrants | Sudan | 2.0 /100 | #252 | Tragic 9.2% |
| Pima | 1.8 /100 | #253 | Tragic 9.2% |
| Immigrants | Ghana | 1.7 /100 | #254 | Tragic 9.2% |
Demographics Similar to Barbadians by Unemployment Among Seniors over 75 years
In terms of unemployment among seniors over 75 years, the demographic groups most similar to Barbadians are South American (8.5%, a difference of 0.090%), Immigrants from Bolivia (8.5%, a difference of 0.090%), Immigrants from Bulgaria (8.5%, a difference of 0.14%), Immigrants from Ukraine (8.5%, a difference of 0.20%), and Immigrants from Costa Rica (8.5%, a difference of 0.23%).
| Demographics | Rating | Rank | Unemployment Among Seniors over 75 years |
| Chileans | 93.8 /100 | #132 | Exceptional 8.4% |
| Serbians | 93.7 /100 | #133 | Exceptional 8.4% |
| Immigrants | Czechoslovakia | 93.4 /100 | #134 | Exceptional 8.4% |
| Haitians | 91.4 /100 | #135 | Exceptional 8.5% |
| Immigrants | Trinidad and Tobago | 90.8 /100 | #136 | Exceptional 8.5% |
| Immigrants | Kuwait | 90.5 /100 | #137 | Exceptional 8.5% |
| Immigrants | Bulgaria | 89.6 /100 | #138 | Excellent 8.5% |
| Barbadians | 88.6 /100 | #139 | Excellent 8.5% |
| South Americans | 87.9 /100 | #140 | Excellent 8.5% |
| Immigrants | Bolivia | 87.9 /100 | #141 | Excellent 8.5% |
| Immigrants | Ukraine | 87.0 /100 | #142 | Excellent 8.5% |
| Immigrants | Costa Rica | 86.8 /100 | #143 | Excellent 8.5% |
| Colombians | 86.7 /100 | #144 | Excellent 8.5% |
| Immigrants | Romania | 86.2 /100 | #145 | Excellent 8.5% |
| Immigrants | South Eastern Asia | 85.8 /100 | #146 | Excellent 8.5% |