Guamanian/Chamorro vs Lumbee Unemployment Among Seniors over 75 years
COMPARE
Guamanian/Chamorro
Lumbee
Unemployment Among Seniors over 75 years
Unemployment Among Seniors over 75 years Comparison
Guamanians/Chamorros
Lumbee
9.0%
UNEMPLOYMENT AMONG SENIORS OVER 75 YEARS
7.7/ 100
METRIC RATING
221st/ 347
METRIC RANK
13.5%
UNEMPLOYMENT AMONG SENIORS OVER 75 YEARS
0.0/ 100
METRIC RATING
341st/ 347
METRIC RANK
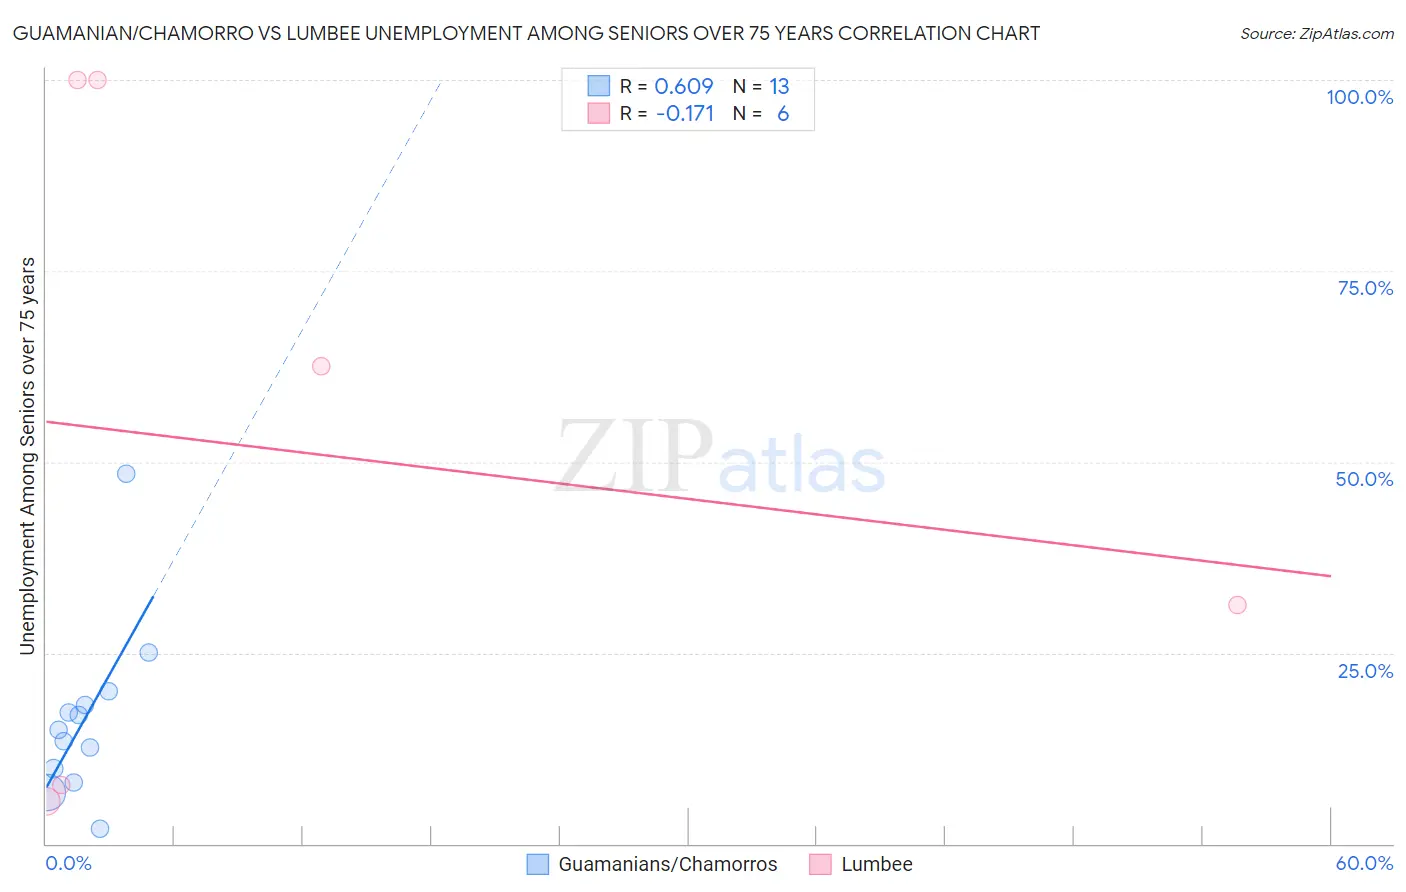
Guamanian/Chamorro vs Lumbee Unemployment Among Seniors over 75 years Correlation Chart
The statistical analysis conducted on geographies consisting of 136,667,243 people shows a significant positive correlation between the proportion of Guamanians/Chamorros and unemployment rate among seniors over the age of 75 in the United States with a correlation coefficient (R) of 0.609 and weighted average of 9.0%. Similarly, the statistical analysis conducted on geographies consisting of 65,452,608 people shows a poor negative correlation between the proportion of Lumbee and unemployment rate among seniors over the age of 75 in the United States with a correlation coefficient (R) of -0.171 and weighted average of 13.5%, a difference of 48.9%.
Unemployment Among Seniors over 75 years Correlation Summary
| Measurement | Guamanian/Chamorro | Lumbee |
| Minimum | 2.0% | 5.5% |
| Maximum | 48.4% | 100.0% |
| Range | 46.4% | 94.5% |
| Mean | 16.4% | 51.2% |
| Median | 14.9% | 46.9% |
| Interquartile 25% (IQ1) | 8.9% | 7.6% |
| Interquartile 75% (IQ3) | 19.0% | 100.0% |
| Interquartile Range (IQR) | 10.1% | 92.4% |
| Standard Deviation (Sample) | 11.4% | 43.1% |
| Standard Deviation (Population) | 10.9% | 39.3% |
Similar Demographics by Unemployment Among Seniors over 75 years
Demographics Similar to Guamanians/Chamorros by Unemployment Among Seniors over 75 years
In terms of unemployment among seniors over 75 years, the demographic groups most similar to Guamanians/Chamorros are Immigrants from Zimbabwe (9.0%, a difference of 0.020%), Peruvian (9.0%, a difference of 0.070%), Afghan (9.0%, a difference of 0.10%), Immigrants from Jordan (9.0%, a difference of 0.14%), and Costa Rican (9.1%, a difference of 0.27%).
| Demographics | Rating | Rank | Unemployment Among Seniors over 75 years |
| Immigrants | Brazil | 13.3 /100 | #214 | Poor 9.0% |
| Immigrants | Western Asia | 12.5 /100 | #215 | Poor 9.0% |
| Immigrants | Oceania | 11.8 /100 | #216 | Poor 9.0% |
| Lebanese | 11.1 /100 | #217 | Poor 9.0% |
| Immigrants | Africa | 9.7 /100 | #218 | Tragic 9.0% |
| Afghans | 8.3 /100 | #219 | Tragic 9.0% |
| Immigrants | Zimbabwe | 7.8 /100 | #220 | Tragic 9.0% |
| Guamanians/Chamorros | 7.7 /100 | #221 | Tragic 9.0% |
| Peruvians | 7.3 /100 | #222 | Tragic 9.0% |
| Immigrants | Jordan | 6.9 /100 | #223 | Tragic 9.0% |
| Costa Ricans | 6.3 /100 | #224 | Tragic 9.1% |
| Navajo | 6.1 /100 | #225 | Tragic 9.1% |
| Immigrants | Bangladesh | 5.9 /100 | #226 | Tragic 9.1% |
| Samoans | 5.7 /100 | #227 | Tragic 9.1% |
| Kenyans | 5.4 /100 | #228 | Tragic 9.1% |
Demographics Similar to Lumbee by Unemployment Among Seniors over 75 years
In terms of unemployment among seniors over 75 years, the demographic groups most similar to Lumbee are Hmong (13.7%, a difference of 2.0%), Yup'ik (12.8%, a difference of 5.5%), Cajun (12.5%, a difference of 7.8%), Alaska Native (14.7%, a difference of 8.9%), and Immigrants from Cabo Verde (12.3%, a difference of 9.2%).
| Demographics | Rating | Rank | Unemployment Among Seniors over 75 years |
| Alaskan Athabascans | 0.0 /100 | #333 | Tragic 11.0% |
| Assyrians/Chaldeans/Syriacs | 0.0 /100 | #334 | Tragic 11.1% |
| French Canadians | 0.0 /100 | #335 | Tragic 11.2% |
| Immigrants | North Macedonia | 0.0 /100 | #336 | Tragic 11.3% |
| Cape Verdeans | 0.0 /100 | #337 | Tragic 11.4% |
| Immigrants | Cabo Verde | 0.0 /100 | #338 | Tragic 12.3% |
| Cajuns | 0.0 /100 | #339 | Tragic 12.5% |
| Yup'ik | 0.0 /100 | #340 | Tragic 12.8% |
| Lumbee | 0.0 /100 | #341 | Tragic 13.5% |
| Hmong | 0.0 /100 | #342 | Tragic 13.7% |
| Alaska Natives | 0.0 /100 | #343 | Tragic 14.7% |
| Immigrants | Yemen | 0.0 /100 | #344 | Tragic 16.5% |
| Yakama | 0.0 /100 | #345 | Tragic 18.4% |
| Tlingit-Haida | 0.0 /100 | #346 | Tragic 20.7% |