Subsaharan African vs Pakistani Unemployment Among Ages 60 to 64 years
COMPARE
Subsaharan African
Pakistani
Unemployment Among Ages 60 to 64 years
Unemployment Among Ages 60 to 64 years Comparison
Sub-Saharan Africans
Pakistanis
4.9%
UNEMPLOYMENT AMONG AGES 60 TO 64 YEARS
38.9/ 100
METRIC RATING
183rd/ 347
METRIC RANK
4.8%
UNEMPLOYMENT AMONG AGES 60 TO 64 YEARS
64.6/ 100
METRIC RATING
164th/ 347
METRIC RANK
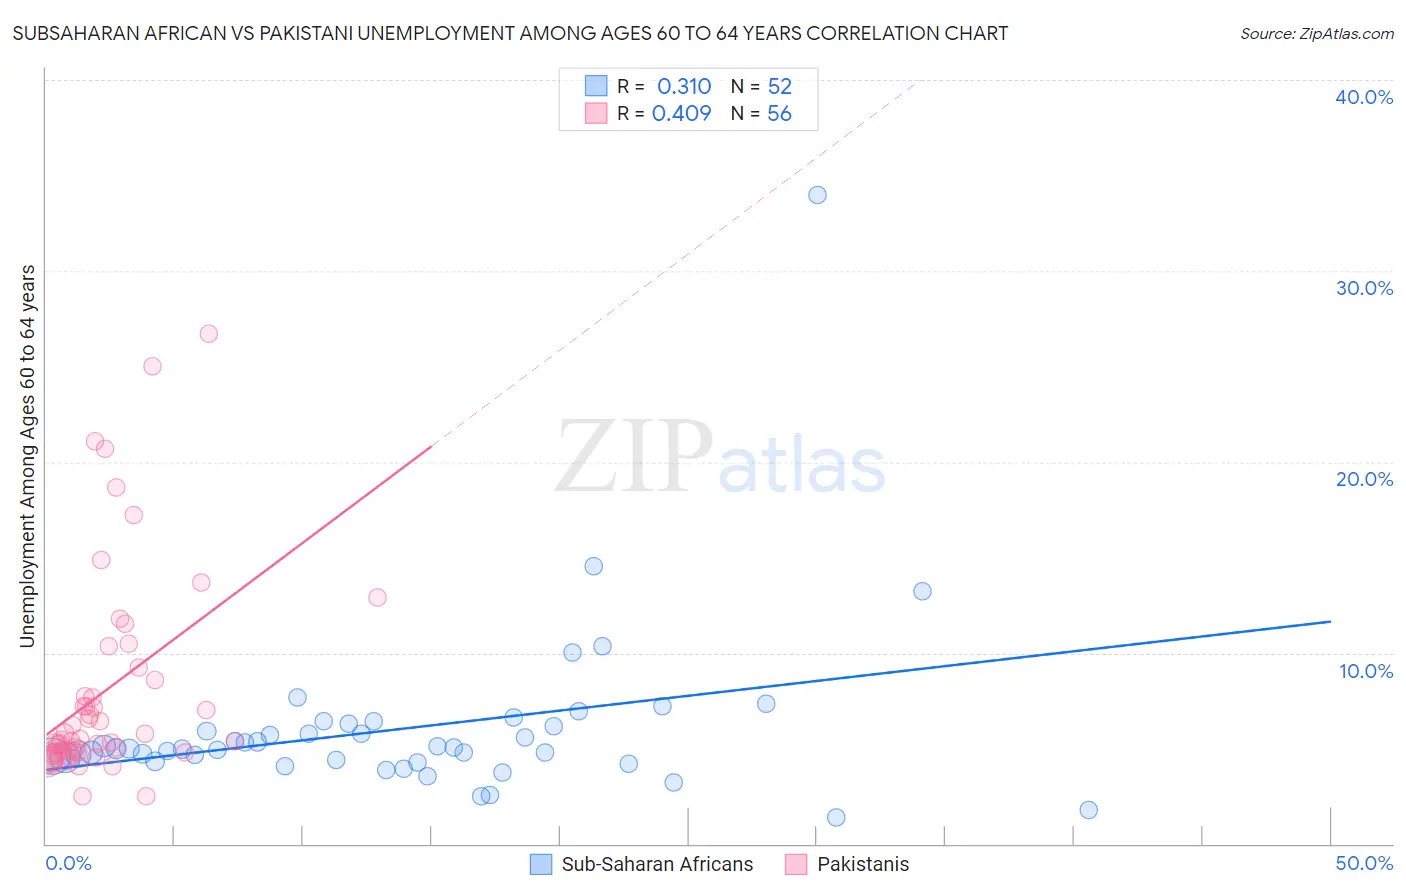
Subsaharan African vs Pakistani Unemployment Among Ages 60 to 64 years Correlation Chart
The statistical analysis conducted on geographies consisting of 438,711,517 people shows a mild positive correlation between the proportion of Sub-Saharan Africans and unemployment rate among population between the ages 60 and 64 in the United States with a correlation coefficient (R) of 0.310 and weighted average of 4.9%. Similarly, the statistical analysis conducted on geographies consisting of 309,696,794 people shows a moderate positive correlation between the proportion of Pakistanis and unemployment rate among population between the ages 60 and 64 in the United States with a correlation coefficient (R) of 0.409 and weighted average of 4.8%, a difference of 0.94%.
Unemployment Among Ages 60 to 64 years Correlation Summary
| Measurement | Subsaharan African | Pakistani |
| Minimum | 1.4% | 2.5% |
| Maximum | 34.0% | 26.7% |
| Range | 32.6% | 24.2% |
| Mean | 6.0% | 8.0% |
| Median | 5.0% | 5.5% |
| Interquartile 25% (IQ1) | 4.4% | 4.8% |
| Interquartile 75% (IQ3) | 6.2% | 8.9% |
| Interquartile Range (IQR) | 1.8% | 4.1% |
| Standard Deviation (Sample) | 4.6% | 5.5% |
| Standard Deviation (Population) | 4.6% | 5.5% |
Demographics Similar to Sub-Saharan Africans and Pakistanis by Unemployment Among Ages 60 to 64 years
In terms of unemployment among ages 60 to 64 years, the demographic groups most similar to Sub-Saharan Africans are Sri Lankan (4.9%, a difference of 0.030%), Asian (4.9%, a difference of 0.070%), Hungarian (4.9%, a difference of 0.070%), Immigrants from Sweden (4.9%, a difference of 0.20%), and Immigrants from Malaysia (4.9%, a difference of 0.21%). Similarly, the demographic groups most similar to Pakistanis are Immigrants from Belgium (4.8%, a difference of 0.010%), Immigrants from Panama (4.8%, a difference of 0.10%), Palestinian (4.8%, a difference of 0.16%), Immigrants from Northern Europe (4.8%, a difference of 0.21%), and Immigrants from Southern Europe (4.8%, a difference of 0.30%).
| Demographics | Rating | Rank | Unemployment Among Ages 60 to 64 years |
| Immigrants | Belgium | 64.8 /100 | #163 | Good 4.8% |
| Pakistanis | 64.6 /100 | #164 | Good 4.8% |
| Immigrants | Panama | 62.0 /100 | #165 | Good 4.8% |
| Palestinians | 60.5 /100 | #166 | Good 4.8% |
| Immigrants | Northern Europe | 59.1 /100 | #167 | Average 4.8% |
| Immigrants | Southern Europe | 56.7 /100 | #168 | Average 4.8% |
| Immigrants | France | 55.5 /100 | #169 | Average 4.8% |
| Immigrants | Korea | 54.2 /100 | #170 | Average 4.8% |
| Samoans | 53.6 /100 | #171 | Average 4.9% |
| Immigrants | Turkey | 52.8 /100 | #172 | Average 4.9% |
| Immigrants | Hungary | 50.2 /100 | #173 | Average 4.9% |
| Immigrants | Western Europe | 50.0 /100 | #174 | Average 4.9% |
| Immigrants | Latvia | 46.9 /100 | #175 | Average 4.9% |
| Bermudans | 46.5 /100 | #176 | Average 4.9% |
| Immigrants | Malaysia | 44.7 /100 | #177 | Average 4.9% |
| Immigrants | Nonimmigrants | 44.5 /100 | #178 | Average 4.9% |
| Immigrants | Sweden | 44.3 /100 | #179 | Average 4.9% |
| Asians | 40.8 /100 | #180 | Average 4.9% |
| Hungarians | 40.6 /100 | #181 | Average 4.9% |
| Sri Lankans | 39.8 /100 | #182 | Fair 4.9% |
| Sub-Saharan Africans | 38.9 /100 | #183 | Fair 4.9% |