Guatemalan vs Black/African American Unemployment Among Ages 60 to 64 years
COMPARE
Guatemalan
Black/African American
Unemployment Among Ages 60 to 64 years
Unemployment Among Ages 60 to 64 years Comparison
Guatemalans
Blacks/African Americans
5.2%
UNEMPLOYMENT AMONG AGES 60 TO 64 YEARS
0.0/ 100
METRIC RATING
278th/ 347
METRIC RANK
5.3%
UNEMPLOYMENT AMONG AGES 60 TO 64 YEARS
0.0/ 100
METRIC RATING
294th/ 347
METRIC RANK
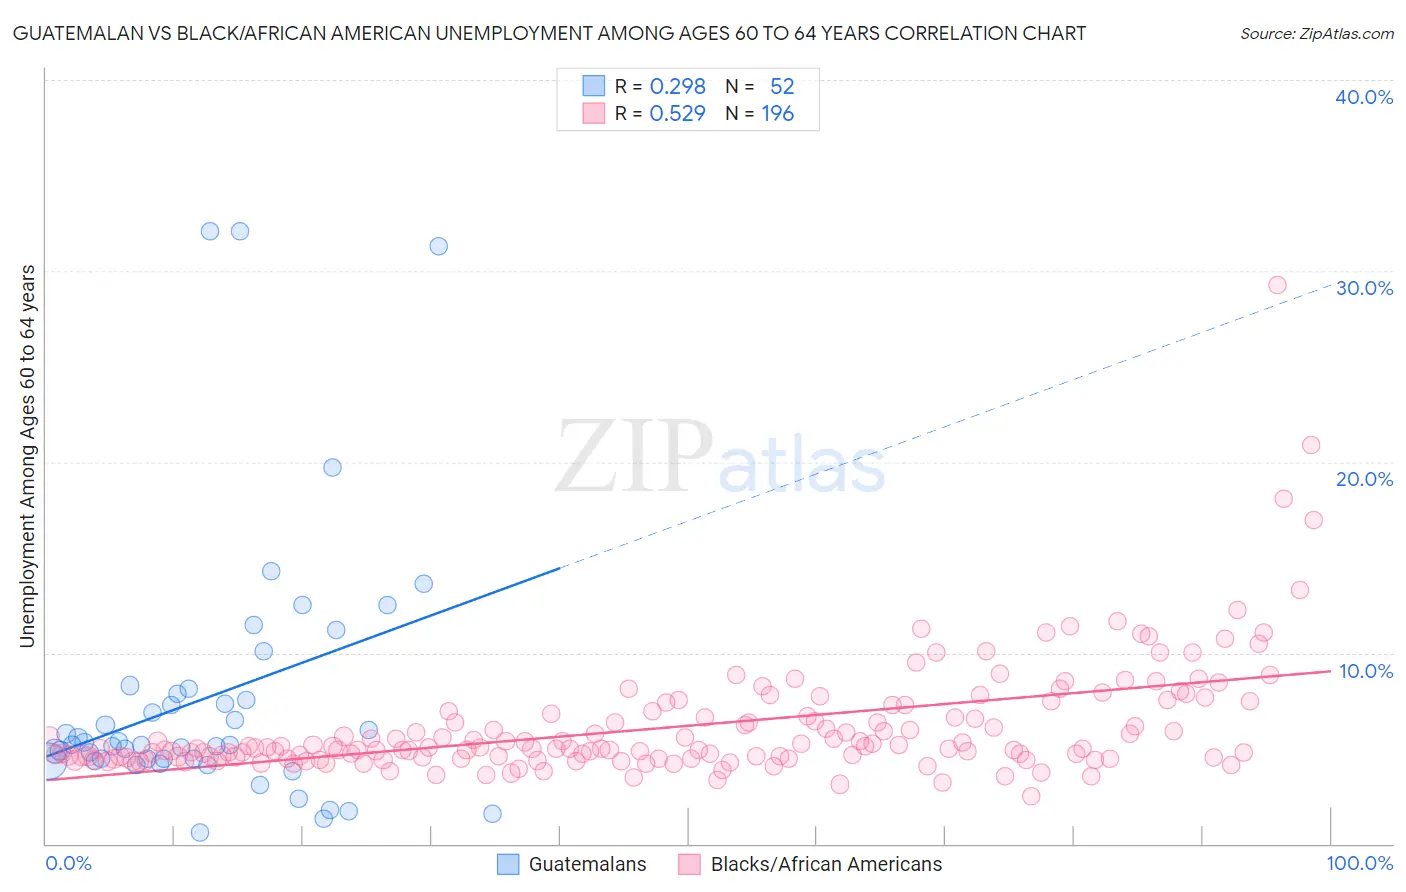
Guatemalan vs Black/African American Unemployment Among Ages 60 to 64 years Correlation Chart
The statistical analysis conducted on geographies consisting of 369,803,797 people shows a weak positive correlation between the proportion of Guatemalans and unemployment rate among population between the ages 60 and 64 in the United States with a correlation coefficient (R) of 0.298 and weighted average of 5.2%. Similarly, the statistical analysis conducted on geographies consisting of 465,577,423 people shows a substantial positive correlation between the proportion of Blacks/African Americans and unemployment rate among population between the ages 60 and 64 in the United States with a correlation coefficient (R) of 0.529 and weighted average of 5.3%, a difference of 1.8%.
Unemployment Among Ages 60 to 64 years Correlation Summary
| Measurement | Guatemalan | Black/African American |
| Minimum | 0.60% | 2.5% |
| Maximum | 32.1% | 29.2% |
| Range | 31.5% | 26.7% |
| Mean | 7.7% | 6.1% |
| Median | 5.2% | 5.0% |
| Interquartile 25% (IQ1) | 4.4% | 4.5% |
| Interquartile 75% (IQ3) | 8.0% | 6.7% |
| Interquartile Range (IQR) | 3.6% | 2.2% |
| Standard Deviation (Sample) | 7.0% | 3.1% |
| Standard Deviation (Population) | 7.0% | 3.1% |
Demographics Similar to Guatemalans and Blacks/African Americans by Unemployment Among Ages 60 to 64 years
In terms of unemployment among ages 60 to 64 years, the demographic groups most similar to Guatemalans are Nepalese (5.2%, a difference of 0.20%), French American Indian (5.2%, a difference of 0.21%), Immigrants from Haiti (5.2%, a difference of 0.25%), Mexican (5.2%, a difference of 0.25%), and Immigrants from Caribbean (5.2%, a difference of 0.37%). Similarly, the demographic groups most similar to Blacks/African Americans are Armenian (5.3%, a difference of 0.030%), Immigrants from Israel (5.3%, a difference of 0.11%), Immigrants from Latin America (5.3%, a difference of 0.13%), Hispanic or Latino (5.3%, a difference of 0.15%), and Jamaican (5.3%, a difference of 0.15%).
| Demographics | Rating | Rank | Unemployment Among Ages 60 to 64 years |
| Central Americans | 0.0 /100 | #276 | Tragic 5.2% |
| Immigrants | Caribbean | 0.0 /100 | #277 | Tragic 5.2% |
| Guatemalans | 0.0 /100 | #278 | Tragic 5.2% |
| Nepalese | 0.0 /100 | #279 | Tragic 5.2% |
| French American Indians | 0.0 /100 | #280 | Tragic 5.2% |
| Immigrants | Haiti | 0.0 /100 | #281 | Tragic 5.2% |
| Mexicans | 0.0 /100 | #282 | Tragic 5.2% |
| Immigrants | Guatemala | 0.0 /100 | #283 | Tragic 5.3% |
| Taiwanese | 0.0 /100 | #284 | Tragic 5.3% |
| West Indians | 0.0 /100 | #285 | Tragic 5.3% |
| Mexican American Indians | 0.0 /100 | #286 | Tragic 5.3% |
| Salvadorans | 0.0 /100 | #287 | Tragic 5.3% |
| Trinidadians and Tobagonians | 0.0 /100 | #288 | Tragic 5.3% |
| Spanish Americans | 0.0 /100 | #289 | Tragic 5.3% |
| Immigrants | Trinidad and Tobago | 0.0 /100 | #290 | Tragic 5.3% |
| Hispanics or Latinos | 0.0 /100 | #291 | Tragic 5.3% |
| Immigrants | Latin America | 0.0 /100 | #292 | Tragic 5.3% |
| Immigrants | Israel | 0.0 /100 | #293 | Tragic 5.3% |
| Blacks/African Americans | 0.0 /100 | #294 | Tragic 5.3% |
| Armenians | 0.0 /100 | #295 | Tragic 5.3% |
| Jamaicans | 0.0 /100 | #296 | Tragic 5.3% |