Sri Lankan vs Yup'ik Unemployment Among Women with Children Ages 6 to 17 years
COMPARE
Sri Lankan
Yup'ik
Unemployment Among Women with Children Ages 6 to 17 years
Unemployment Among Women with Children Ages 6 to 17 years Comparison
Sri Lankans
Yup'ik
8.5%
UNEMPLOYMENT AMONG WOMEN WITH CHILDREN AGES 6 TO 17 YEARS
98.7/ 100
METRIC RATING
95th/ 347
METRIC RANK
18.6%
UNEMPLOYMENT AMONG WOMEN WITH CHILDREN AGES 6 TO 17 YEARS
0.0/ 100
METRIC RATING
346th/ 347
METRIC RANK
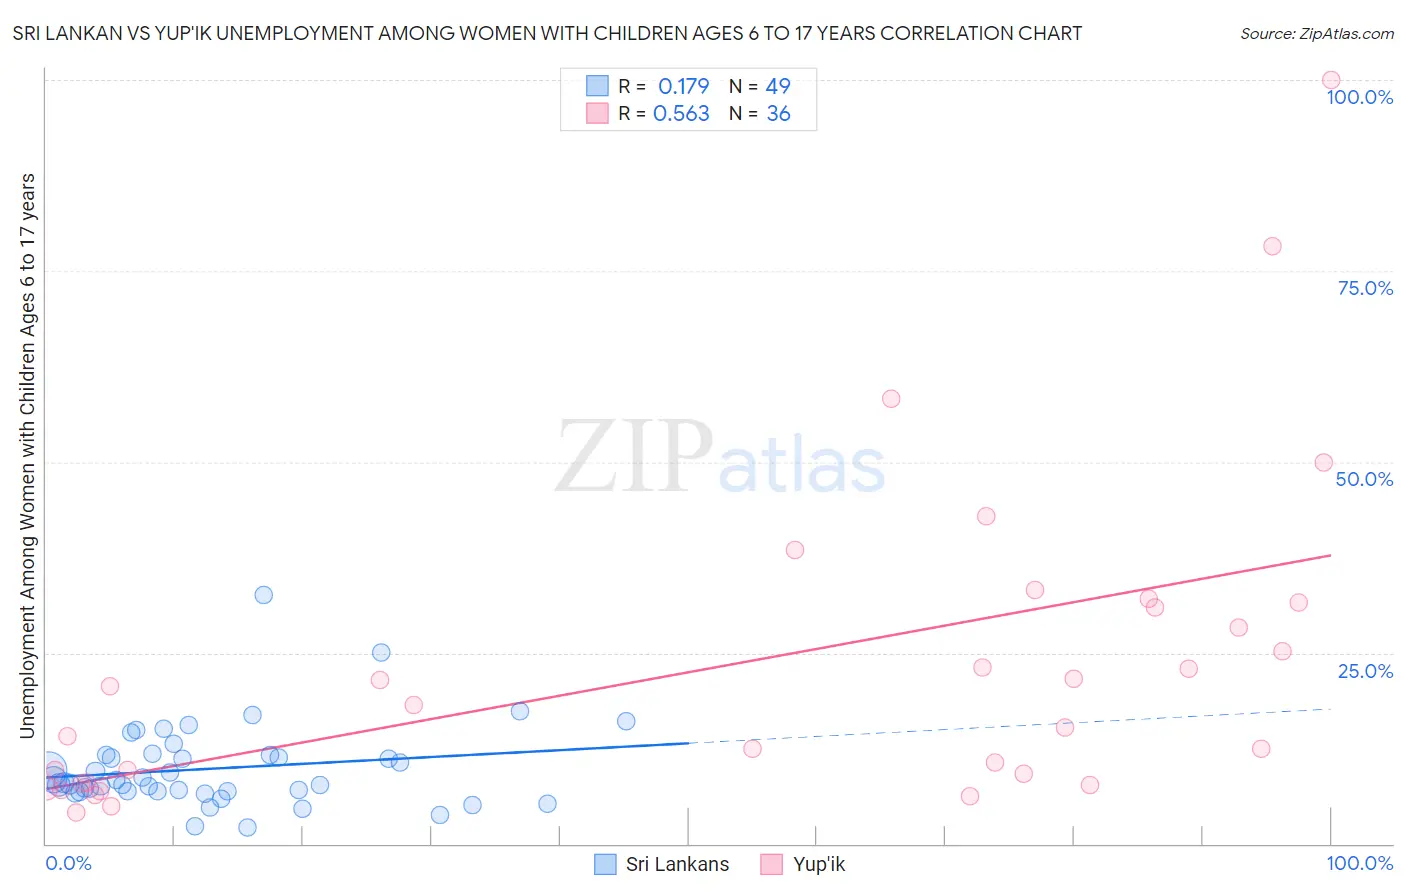
Sri Lankan vs Yup'ik Unemployment Among Women with Children Ages 6 to 17 years Correlation Chart
The statistical analysis conducted on geographies consisting of 312,508,075 people shows a poor positive correlation between the proportion of Sri Lankans and unemployment rate among women with children between the ages 6 and 17 in the United States with a correlation coefficient (R) of 0.179 and weighted average of 8.5%. Similarly, the statistical analysis conducted on geographies consisting of 36,613,945 people shows a substantial positive correlation between the proportion of Yup'ik and unemployment rate among women with children between the ages 6 and 17 in the United States with a correlation coefficient (R) of 0.563 and weighted average of 18.6%, a difference of 118.1%.
Unemployment Among Women with Children Ages 6 to 17 years Correlation Summary
| Measurement | Sri Lankan | Yup'ik |
| Minimum | 2.2% | 4.1% |
| Maximum | 32.5% | 100.0% |
| Range | 30.3% | 95.9% |
| Mean | 9.8% | 23.2% |
| Median | 8.0% | 16.7% |
| Interquartile 25% (IQ1) | 6.8% | 7.9% |
| Interquartile 75% (IQ3) | 11.6% | 31.3% |
| Interquartile Range (IQR) | 4.8% | 23.4% |
| Standard Deviation (Sample) | 5.4% | 21.2% |
| Standard Deviation (Population) | 5.4% | 20.9% |
Similar Demographics by Unemployment Among Women with Children Ages 6 to 17 years
Demographics Similar to Sri Lankans by Unemployment Among Women with Children Ages 6 to 17 years
In terms of unemployment among women with children ages 6 to 17 years, the demographic groups most similar to Sri Lankans are Immigrants from Barbados (8.5%, a difference of 0.060%), German Russian (8.5%, a difference of 0.070%), Bolivian (8.5%, a difference of 0.15%), Australian (8.5%, a difference of 0.16%), and Malaysian (8.6%, a difference of 0.20%).
| Demographics | Rating | Rank | Unemployment Among Women with Children Ages 6 to 17 years |
| Immigrants | Vietnam | 99.1 /100 | #88 | Exceptional 8.5% |
| Paiute | 99.1 /100 | #89 | Exceptional 8.5% |
| Yugoslavians | 99.0 /100 | #90 | Exceptional 8.5% |
| Immigrants | Eastern Europe | 99.0 /100 | #91 | Exceptional 8.5% |
| Potawatomi | 99.0 /100 | #92 | Exceptional 8.5% |
| Australians | 98.9 /100 | #93 | Exceptional 8.5% |
| Immigrants | Barbados | 98.8 /100 | #94 | Exceptional 8.5% |
| Sri Lankans | 98.7 /100 | #95 | Exceptional 8.5% |
| German Russians | 98.6 /100 | #96 | Exceptional 8.5% |
| Bolivians | 98.5 /100 | #97 | Exceptional 8.5% |
| Malaysians | 98.5 /100 | #98 | Exceptional 8.6% |
| Immigrants | Lithuania | 98.4 /100 | #99 | Exceptional 8.6% |
| New Zealanders | 98.4 /100 | #100 | Exceptional 8.6% |
| Immigrants | Pakistan | 98.4 /100 | #101 | Exceptional 8.6% |
| Immigrants | South Africa | 98.3 /100 | #102 | Exceptional 8.6% |
Demographics Similar to Yup'ik by Unemployment Among Women with Children Ages 6 to 17 years
In terms of unemployment among women with children ages 6 to 17 years, the demographic groups most similar to Yup'ik are Pima (18.9%, a difference of 1.4%), Arapaho (16.8%, a difference of 10.4%), Cheyenne (16.4%, a difference of 13.6%), Inupiat (14.9%, a difference of 25.3%), and Yuman (14.8%, a difference of 25.7%).
| Demographics | Rating | Rank | Unemployment Among Women with Children Ages 6 to 17 years |
| Natives/Alaskans | 0.0 /100 | #333 | Tragic 11.5% |
| Ugandans | 0.0 /100 | #334 | Tragic 12.0% |
| Colville | 0.0 /100 | #335 | Tragic 12.3% |
| Houma | 0.0 /100 | #336 | Tragic 12.5% |
| Immigrants | Yemen | 0.0 /100 | #337 | Tragic 12.7% |
| Hopi | 0.0 /100 | #338 | Tragic 12.9% |
| Sioux | 0.0 /100 | #339 | Tragic 13.2% |
| Puerto Ricans | 0.0 /100 | #340 | Tragic 13.9% |
| Navajo | 0.0 /100 | #341 | Tragic 14.2% |
| Yuman | 0.0 /100 | #342 | Tragic 14.8% |
| Inupiat | 0.0 /100 | #343 | Tragic 14.9% |
| Cheyenne | 0.0 /100 | #344 | Tragic 16.4% |
| Arapaho | 0.0 /100 | #345 | Tragic 16.8% |
| Yup'ik | 0.0 /100 | #346 | Tragic 18.6% |
| Pima | 0.0 /100 | #347 | Tragic 18.9% |