Sri Lankan vs Macedonian Unemployment Among Women with Children Ages 6 to 17 years
COMPARE
Sri Lankan
Macedonian
Unemployment Among Women with Children Ages 6 to 17 years
Unemployment Among Women with Children Ages 6 to 17 years Comparison
Sri Lankans
Macedonians
8.5%
UNEMPLOYMENT AMONG WOMEN WITH CHILDREN AGES 6 TO 17 YEARS
98.7/ 100
METRIC RATING
95th/ 347
METRIC RANK
9.3%
UNEMPLOYMENT AMONG WOMEN WITH CHILDREN AGES 6 TO 17 YEARS
3.9/ 100
METRIC RATING
231st/ 347
METRIC RANK
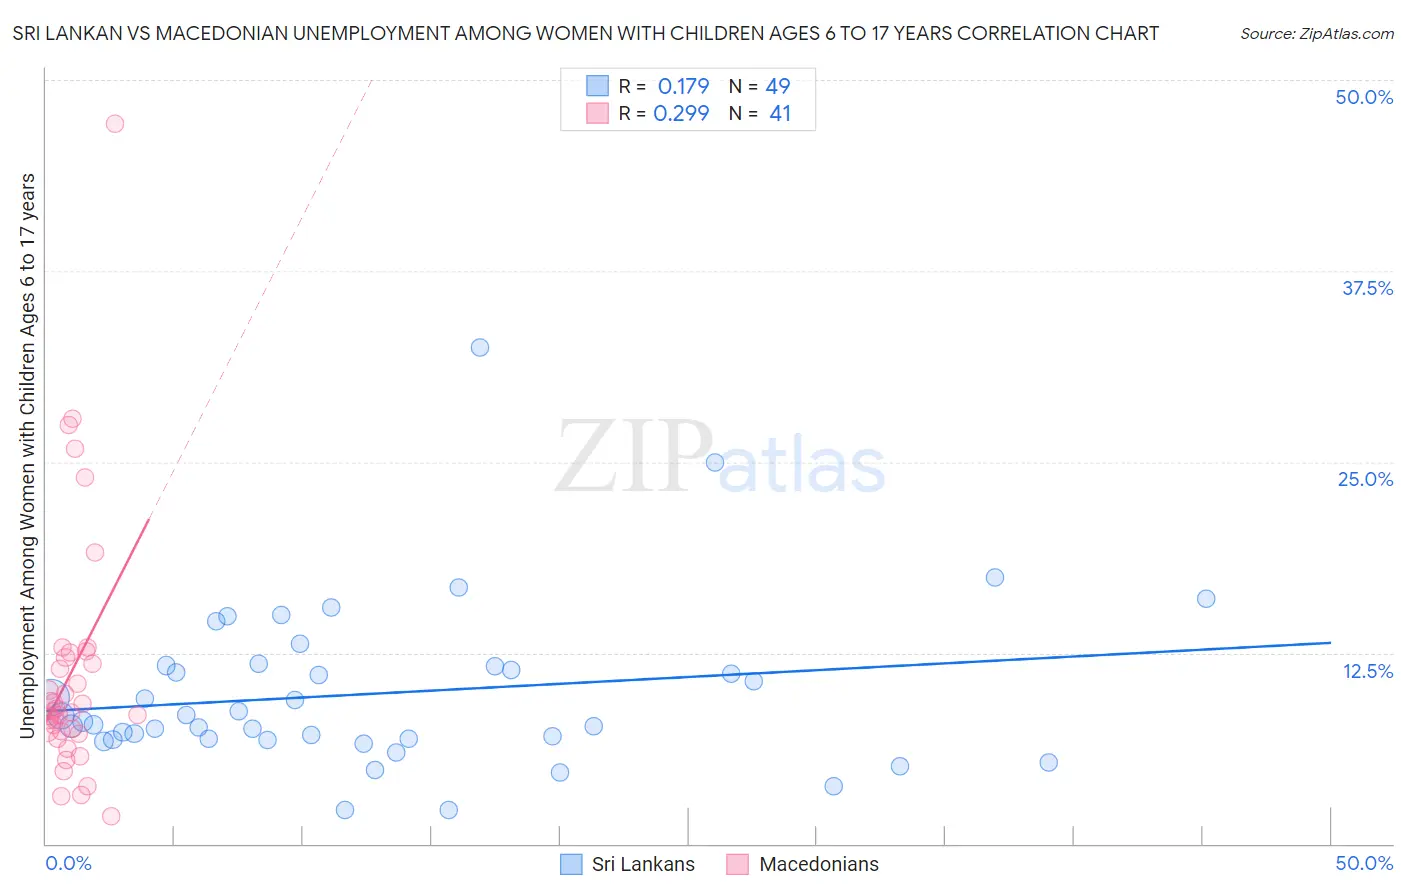
Sri Lankan vs Macedonian Unemployment Among Women with Children Ages 6 to 17 years Correlation Chart
The statistical analysis conducted on geographies consisting of 312,508,075 people shows a poor positive correlation between the proportion of Sri Lankans and unemployment rate among women with children between the ages 6 and 17 in the United States with a correlation coefficient (R) of 0.179 and weighted average of 8.5%. Similarly, the statistical analysis conducted on geographies consisting of 106,790,801 people shows a weak positive correlation between the proportion of Macedonians and unemployment rate among women with children between the ages 6 and 17 in the United States with a correlation coefficient (R) of 0.299 and weighted average of 9.3%, a difference of 8.8%.
Unemployment Among Women with Children Ages 6 to 17 years Correlation Summary
| Measurement | Sri Lankan | Macedonian |
| Minimum | 2.2% | 1.8% |
| Maximum | 32.5% | 47.1% |
| Range | 30.3% | 45.3% |
| Mean | 9.8% | 11.3% |
| Median | 8.0% | 8.7% |
| Interquartile 25% (IQ1) | 6.8% | 7.3% |
| Interquartile 75% (IQ3) | 11.6% | 12.3% |
| Interquartile Range (IQR) | 4.8% | 5.1% |
| Standard Deviation (Sample) | 5.4% | 8.4% |
| Standard Deviation (Population) | 5.4% | 8.3% |
Similar Demographics by Unemployment Among Women with Children Ages 6 to 17 years
Demographics Similar to Sri Lankans by Unemployment Among Women with Children Ages 6 to 17 years
In terms of unemployment among women with children ages 6 to 17 years, the demographic groups most similar to Sri Lankans are Immigrants from Barbados (8.5%, a difference of 0.060%), German Russian (8.5%, a difference of 0.070%), Bolivian (8.5%, a difference of 0.15%), Australian (8.5%, a difference of 0.16%), and Malaysian (8.6%, a difference of 0.20%).
| Demographics | Rating | Rank | Unemployment Among Women with Children Ages 6 to 17 years |
| Immigrants | Vietnam | 99.1 /100 | #88 | Exceptional 8.5% |
| Paiute | 99.1 /100 | #89 | Exceptional 8.5% |
| Yugoslavians | 99.0 /100 | #90 | Exceptional 8.5% |
| Immigrants | Eastern Europe | 99.0 /100 | #91 | Exceptional 8.5% |
| Potawatomi | 99.0 /100 | #92 | Exceptional 8.5% |
| Australians | 98.9 /100 | #93 | Exceptional 8.5% |
| Immigrants | Barbados | 98.8 /100 | #94 | Exceptional 8.5% |
| Sri Lankans | 98.7 /100 | #95 | Exceptional 8.5% |
| German Russians | 98.6 /100 | #96 | Exceptional 8.5% |
| Bolivians | 98.5 /100 | #97 | Exceptional 8.5% |
| Malaysians | 98.5 /100 | #98 | Exceptional 8.6% |
| Immigrants | Lithuania | 98.4 /100 | #99 | Exceptional 8.6% |
| New Zealanders | 98.4 /100 | #100 | Exceptional 8.6% |
| Immigrants | Pakistan | 98.4 /100 | #101 | Exceptional 8.6% |
| Immigrants | South Africa | 98.3 /100 | #102 | Exceptional 8.6% |
Demographics Similar to Macedonians by Unemployment Among Women with Children Ages 6 to 17 years
In terms of unemployment among women with children ages 6 to 17 years, the demographic groups most similar to Macedonians are Welsh (9.3%, a difference of 0.010%), French American Indian (9.3%, a difference of 0.060%), Lumbee (9.3%, a difference of 0.10%), Estonian (9.3%, a difference of 0.14%), and Panamanian (9.3%, a difference of 0.16%).
| Demographics | Rating | Rank | Unemployment Among Women with Children Ages 6 to 17 years |
| Immigrants | El Salvador | 5.3 /100 | #224 | Tragic 9.3% |
| Chinese | 5.2 /100 | #225 | Tragic 9.3% |
| Immigrants | Azores | 4.6 /100 | #226 | Tragic 9.3% |
| Panamanians | 4.5 /100 | #227 | Tragic 9.3% |
| Estonians | 4.4 /100 | #228 | Tragic 9.3% |
| Lumbee | 4.3 /100 | #229 | Tragic 9.3% |
| Welsh | 4.0 /100 | #230 | Tragic 9.3% |
| Macedonians | 3.9 /100 | #231 | Tragic 9.3% |
| French American Indians | 3.7 /100 | #232 | Tragic 9.3% |
| Immigrants | St. Vincent and the Grenadines | 3.3 /100 | #233 | Tragic 9.3% |
| Mexicans | 3.2 /100 | #234 | Tragic 9.3% |
| Uruguayans | 3.0 /100 | #235 | Tragic 9.3% |
| Hungarians | 3.0 /100 | #236 | Tragic 9.3% |
| Immigrants | Belize | 2.8 /100 | #237 | Tragic 9.3% |
| Arabs | 2.7 /100 | #238 | Tragic 9.3% |