Immigrants from Northern Africa vs Yup'ik Unemployment Among Women with Children Ages 6 to 17 years
COMPARE
Immigrants from Northern Africa
Yup'ik
Unemployment Among Women with Children Ages 6 to 17 years
Unemployment Among Women with Children Ages 6 to 17 years Comparison
Immigrants from Northern Africa
Yup'ik
8.7%
UNEMPLOYMENT AMONG WOMEN WITH CHILDREN AGES 6 TO 17 YEARS
94.4/ 100
METRIC RATING
126th/ 347
METRIC RANK
18.6%
UNEMPLOYMENT AMONG WOMEN WITH CHILDREN AGES 6 TO 17 YEARS
0.0/ 100
METRIC RATING
346th/ 347
METRIC RANK
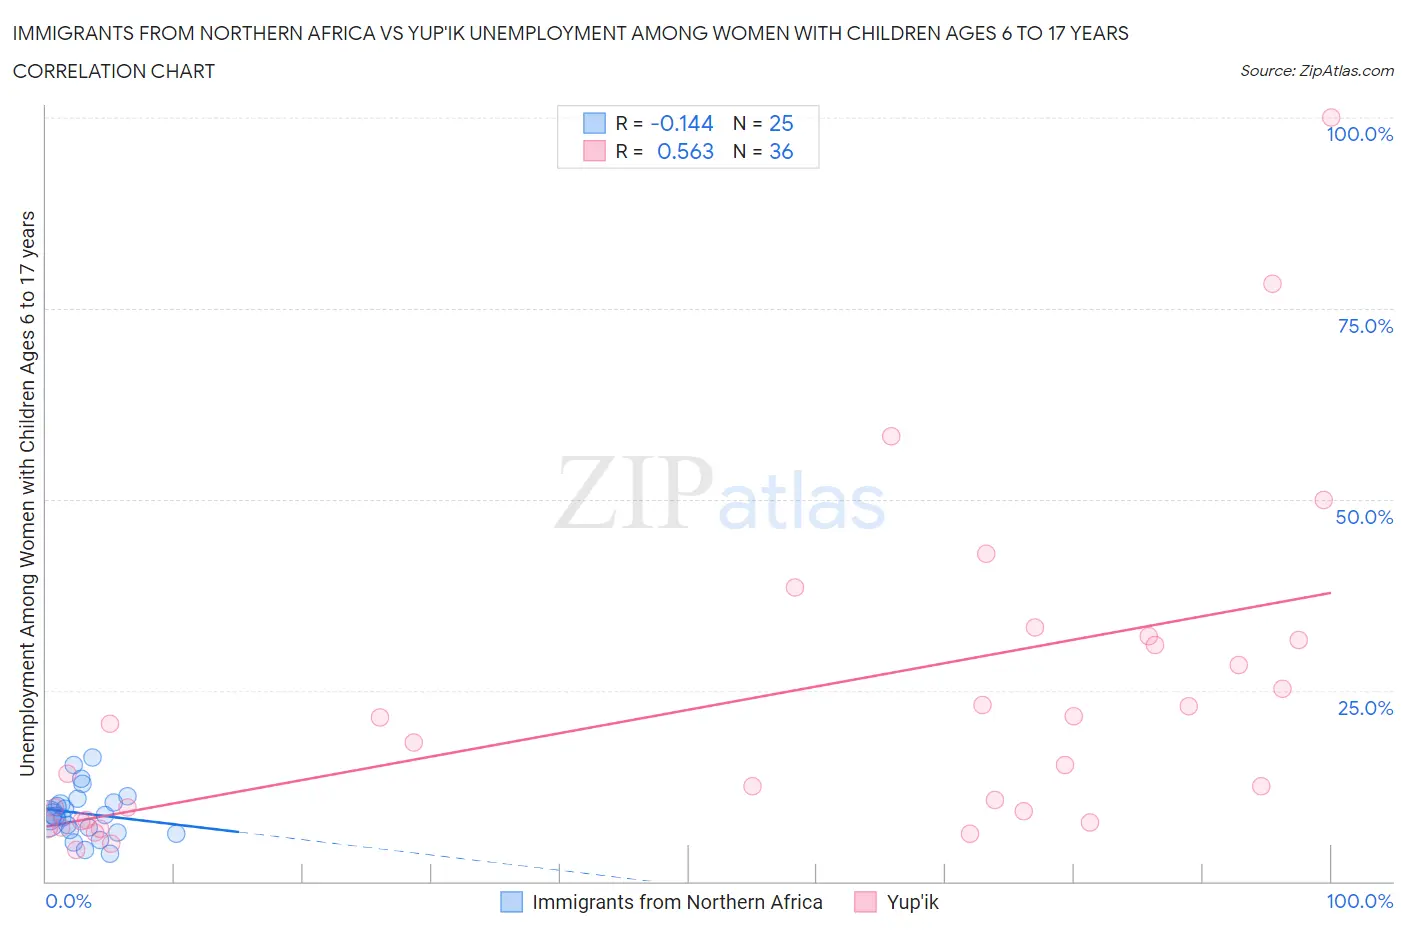
Immigrants from Northern Africa vs Yup'ik Unemployment Among Women with Children Ages 6 to 17 years Correlation Chart
The statistical analysis conducted on geographies consisting of 243,403,953 people shows a poor negative correlation between the proportion of Immigrants from Northern Africa and unemployment rate among women with children between the ages 6 and 17 in the United States with a correlation coefficient (R) of -0.144 and weighted average of 8.7%. Similarly, the statistical analysis conducted on geographies consisting of 36,613,945 people shows a substantial positive correlation between the proportion of Yup'ik and unemployment rate among women with children between the ages 6 and 17 in the United States with a correlation coefficient (R) of 0.563 and weighted average of 18.6%, a difference of 114.3%.
Unemployment Among Women with Children Ages 6 to 17 years Correlation Summary
| Measurement | Immigrants from Northern Africa | Yup'ik |
| Minimum | 3.6% | 4.1% |
| Maximum | 16.2% | 100.0% |
| Range | 12.6% | 95.9% |
| Mean | 8.9% | 23.2% |
| Median | 8.5% | 16.7% |
| Interquartile 25% (IQ1) | 6.5% | 7.9% |
| Interquartile 75% (IQ3) | 10.5% | 31.3% |
| Interquartile Range (IQR) | 4.0% | 23.4% |
| Standard Deviation (Sample) | 3.2% | 21.2% |
| Standard Deviation (Population) | 3.1% | 20.9% |
Similar Demographics by Unemployment Among Women with Children Ages 6 to 17 years
Demographics Similar to Immigrants from Northern Africa by Unemployment Among Women with Children Ages 6 to 17 years
In terms of unemployment among women with children ages 6 to 17 years, the demographic groups most similar to Immigrants from Northern Africa are Czech (8.7%, a difference of 0.010%), South African (8.7%, a difference of 0.030%), Hmong (8.7%, a difference of 0.030%), Immigrants from Morocco (8.7%, a difference of 0.10%), and Immigrants from Lebanon (8.7%, a difference of 0.10%).
| Demographics | Rating | Rank | Unemployment Among Women with Children Ages 6 to 17 years |
| Immigrants | Grenada | 96.2 /100 | #119 | Exceptional 8.6% |
| Israelis | 95.9 /100 | #120 | Exceptional 8.7% |
| Immigrants | Denmark | 95.5 /100 | #121 | Exceptional 8.7% |
| Immigrants | Egypt | 95.0 /100 | #122 | Exceptional 8.7% |
| Immigrants | Morocco | 94.9 /100 | #123 | Exceptional 8.7% |
| Immigrants | Lebanon | 94.9 /100 | #124 | Exceptional 8.7% |
| South Africans | 94.6 /100 | #125 | Exceptional 8.7% |
| Immigrants | Northern Africa | 94.4 /100 | #126 | Exceptional 8.7% |
| Czechs | 94.4 /100 | #127 | Exceptional 8.7% |
| Hmong | 94.3 /100 | #128 | Exceptional 8.7% |
| Barbadians | 93.8 /100 | #129 | Exceptional 8.7% |
| Immigrants | Western Asia | 93.1 /100 | #130 | Exceptional 8.7% |
| Slavs | 92.2 /100 | #131 | Exceptional 8.7% |
| Yaqui | 92.2 /100 | #132 | Exceptional 8.7% |
| Egyptians | 91.8 /100 | #133 | Exceptional 8.7% |
Demographics Similar to Yup'ik by Unemployment Among Women with Children Ages 6 to 17 years
In terms of unemployment among women with children ages 6 to 17 years, the demographic groups most similar to Yup'ik are Pima (18.9%, a difference of 1.4%), Arapaho (16.8%, a difference of 10.4%), Cheyenne (16.4%, a difference of 13.6%), Inupiat (14.9%, a difference of 25.3%), and Yuman (14.8%, a difference of 25.7%).
| Demographics | Rating | Rank | Unemployment Among Women with Children Ages 6 to 17 years |
| Natives/Alaskans | 0.0 /100 | #333 | Tragic 11.5% |
| Ugandans | 0.0 /100 | #334 | Tragic 12.0% |
| Colville | 0.0 /100 | #335 | Tragic 12.3% |
| Houma | 0.0 /100 | #336 | Tragic 12.5% |
| Immigrants | Yemen | 0.0 /100 | #337 | Tragic 12.7% |
| Hopi | 0.0 /100 | #338 | Tragic 12.9% |
| Sioux | 0.0 /100 | #339 | Tragic 13.2% |
| Puerto Ricans | 0.0 /100 | #340 | Tragic 13.9% |
| Navajo | 0.0 /100 | #341 | Tragic 14.2% |
| Yuman | 0.0 /100 | #342 | Tragic 14.8% |
| Inupiat | 0.0 /100 | #343 | Tragic 14.9% |
| Cheyenne | 0.0 /100 | #344 | Tragic 16.4% |
| Arapaho | 0.0 /100 | #345 | Tragic 16.8% |
| Yup'ik | 0.0 /100 | #346 | Tragic 18.6% |
| Pima | 0.0 /100 | #347 | Tragic 18.9% |