Sri Lankan vs Yup'ik Professional Degree
COMPARE
Sri Lankan
Yup'ik
Professional Degree
Professional Degree Comparison
Sri Lankans
Yup'ik
4.3%
PROFESSIONAL DEGREE
29.0/ 100
METRIC RATING
191st/ 347
METRIC RANK
2.9%
PROFESSIONAL DEGREE
0.0/ 100
METRIC RATING
340th/ 347
METRIC RANK
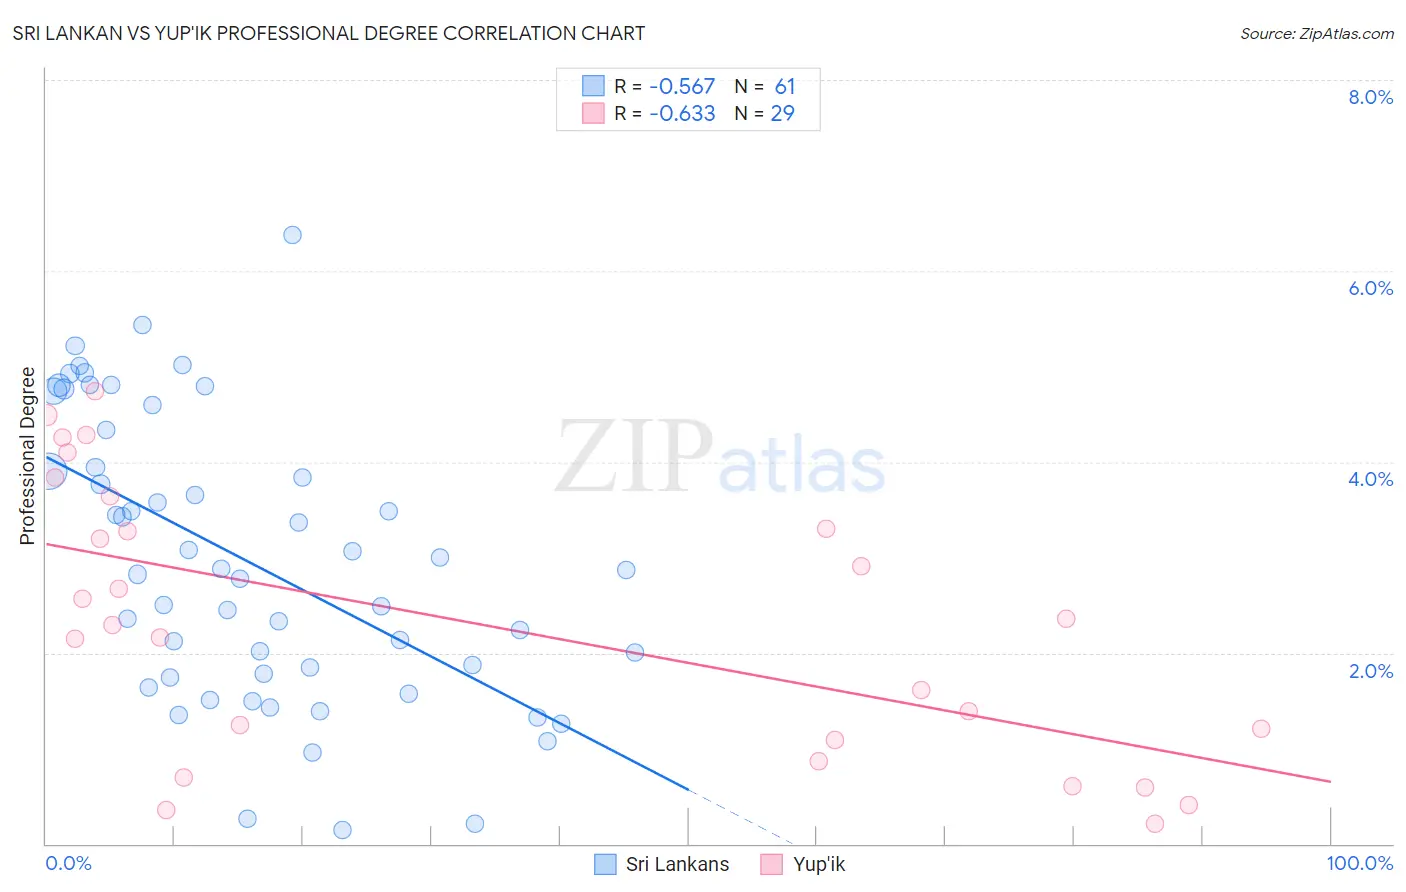
Sri Lankan vs Yup'ik Professional Degree Correlation Chart
The statistical analysis conducted on geographies consisting of 439,314,043 people shows a substantial negative correlation between the proportion of Sri Lankans and percentage of population with at least professional degree education in the United States with a correlation coefficient (R) of -0.567 and weighted average of 4.3%. Similarly, the statistical analysis conducted on geographies consisting of 39,870,303 people shows a significant negative correlation between the proportion of Yup'ik and percentage of population with at least professional degree education in the United States with a correlation coefficient (R) of -0.633 and weighted average of 2.9%, a difference of 48.6%.
Professional Degree Correlation Summary
| Measurement | Sri Lankan | Yup'ik |
| Minimum | 0.14% | 0.21% |
| Maximum | 6.4% | 4.7% |
| Range | 6.2% | 4.5% |
| Mean | 3.0% | 2.3% |
| Median | 2.9% | 2.3% |
| Interquartile 25% (IQ1) | 1.8% | 0.98% |
| Interquartile 75% (IQ3) | 4.1% | 3.5% |
| Interquartile Range (IQR) | 2.4% | 2.5% |
| Standard Deviation (Sample) | 1.5% | 1.4% |
| Standard Deviation (Population) | 1.5% | 1.4% |
Similar Demographics by Professional Degree
Demographics Similar to Sri Lankans by Professional Degree
In terms of professional degree, the demographic groups most similar to Sri Lankans are Immigrants from Poland (4.3%, a difference of 0.040%), Slovak (4.3%, a difference of 0.30%), Ghanaian (4.3%, a difference of 0.32%), French (4.2%, a difference of 0.37%), and Immigrants from Thailand (4.3%, a difference of 0.47%).
| Demographics | Rating | Rank | Professional Degree |
| Belgians | 36.2 /100 | #184 | Fair 4.3% |
| Welsh | 35.8 /100 | #185 | Fair 4.3% |
| Scotch-Irish | 34.2 /100 | #186 | Fair 4.3% |
| Immigrants | Cameroon | 33.3 /100 | #187 | Fair 4.3% |
| Immigrants | Thailand | 31.7 /100 | #188 | Fair 4.3% |
| Slovaks | 30.7 /100 | #189 | Fair 4.3% |
| Immigrants | Poland | 29.2 /100 | #190 | Fair 4.3% |
| Sri Lankans | 29.0 /100 | #191 | Fair 4.3% |
| Ghanaians | 27.3 /100 | #192 | Fair 4.3% |
| French | 27.1 /100 | #193 | Fair 4.2% |
| Scandinavians | 25.8 /100 | #194 | Fair 4.2% |
| Nigerians | 24.6 /100 | #195 | Fair 4.2% |
| Spanish | 23.0 /100 | #196 | Fair 4.2% |
| Czechoslovakians | 22.4 /100 | #197 | Fair 4.2% |
| Immigrants | Middle Africa | 22.1 /100 | #198 | Fair 4.2% |
Demographics Similar to Yup'ik by Professional Degree
In terms of professional degree, the demographic groups most similar to Yup'ik are Immigrants from Central America (2.9%, a difference of 0.050%), Navajo (2.9%, a difference of 0.17%), Arapaho (2.9%, a difference of 0.24%), Tohono O'odham (2.8%, a difference of 0.78%), and Immigrants from the Azores (2.8%, a difference of 1.4%).
| Demographics | Rating | Rank | Professional Degree |
| Puget Sound Salish | 0.0 /100 | #333 | Tragic 3.1% |
| Pennsylvania Germans | 0.0 /100 | #334 | Tragic 3.0% |
| Natives/Alaskans | 0.0 /100 | #335 | Tragic 3.0% |
| Fijians | 0.0 /100 | #336 | Tragic 2.9% |
| Arapaho | 0.0 /100 | #337 | Tragic 2.9% |
| Navajo | 0.0 /100 | #338 | Tragic 2.9% |
| Immigrants | Central America | 0.0 /100 | #339 | Tragic 2.9% |
| Yup'ik | 0.0 /100 | #340 | Tragic 2.9% |
| Tohono O'odham | 0.0 /100 | #341 | Tragic 2.8% |
| Immigrants | Azores | 0.0 /100 | #342 | Tragic 2.8% |
| Mexicans | 0.0 /100 | #343 | Tragic 2.7% |
| Spanish American Indians | 0.0 /100 | #344 | Tragic 2.7% |
| Immigrants | Mexico | 0.0 /100 | #345 | Tragic 2.6% |
| Lumbee | 0.0 /100 | #346 | Tragic 2.5% |
| Houma | 0.0 /100 | #347 | Tragic 2.2% |