Spanish vs Immigrants from Middle Africa Male Unemployment
COMPARE
Spanish
Immigrants from Middle Africa
Male Unemployment
Male Unemployment Comparison
Spanish
Immigrants from Middle Africa
5.4%
MALE UNEMPLOYMENT
19.7/ 100
METRIC RATING
194th/ 347
METRIC RANK
5.5%
MALE UNEMPLOYMENT
8.3/ 100
METRIC RATING
209th/ 347
METRIC RANK
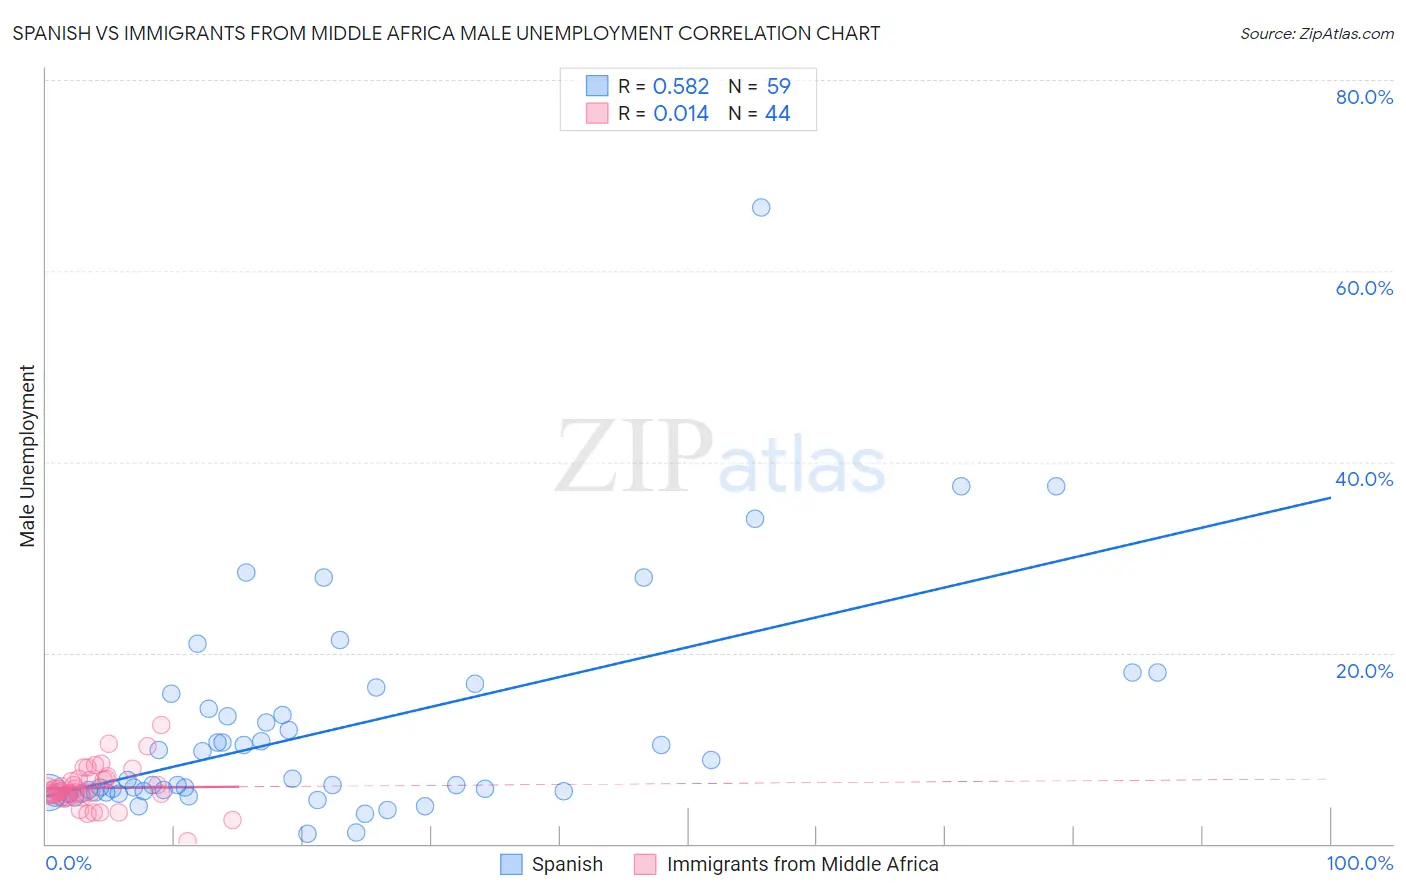
Spanish vs Immigrants from Middle Africa Male Unemployment Correlation Chart
The statistical analysis conducted on geographies consisting of 419,777,027 people shows a substantial positive correlation between the proportion of Spanish and unemployment rate among males in the United States with a correlation coefficient (R) of 0.582 and weighted average of 5.4%. Similarly, the statistical analysis conducted on geographies consisting of 202,406,259 people shows no correlation between the proportion of Immigrants from Middle Africa and unemployment rate among males in the United States with a correlation coefficient (R) of 0.014 and weighted average of 5.5%, a difference of 1.4%.
Male Unemployment Correlation Summary
| Measurement | Spanish | Immigrants from Middle Africa |
| Minimum | 1.1% | 0.20% |
| Maximum | 66.7% | 12.5% |
| Range | 65.6% | 12.3% |
| Mean | 11.8% | 5.9% |
| Median | 6.2% | 5.5% |
| Interquartile 25% (IQ1) | 5.3% | 5.0% |
| Interquartile 75% (IQ3) | 14.1% | 6.8% |
| Interquartile Range (IQR) | 8.8% | 1.8% |
| Standard Deviation (Sample) | 11.4% | 2.1% |
| Standard Deviation (Population) | 11.3% | 2.1% |
Demographics Similar to Spanish and Immigrants from Middle Africa by Male Unemployment
In terms of male unemployment, the demographic groups most similar to Spanish are Immigrants from Southern Europe (5.4%, a difference of 0.18%), Albanian (5.4%, a difference of 0.22%), Alsatian (5.4%, a difference of 0.28%), Immigrants from Israel (5.4%, a difference of 0.46%), and Immigrants from Thailand (5.4%, a difference of 0.50%). Similarly, the demographic groups most similar to Immigrants from Middle Africa are Immigrants from Lebanon (5.5%, a difference of 0.050%), South American Indian (5.5%, a difference of 0.13%), Israeli (5.5%, a difference of 0.17%), Immigrants from Syria (5.5%, a difference of 0.18%), and Immigrants from Ukraine (5.5%, a difference of 0.28%).
| Demographics | Rating | Rank | Male Unemployment |
| Immigrants | South Eastern Asia | 28.2 /100 | #191 | Fair 5.4% |
| Immigrants | Belarus | 26.0 /100 | #192 | Fair 5.4% |
| Immigrants | Israel | 25.2 /100 | #193 | Fair 5.4% |
| Spanish | 19.7 /100 | #194 | Poor 5.4% |
| Immigrants | Southern Europe | 17.7 /100 | #195 | Poor 5.4% |
| Albanians | 17.3 /100 | #196 | Poor 5.4% |
| Alsatians | 16.7 /100 | #197 | Poor 5.4% |
| Immigrants | Thailand | 14.7 /100 | #198 | Poor 5.4% |
| Immigrants | Greece | 14.5 /100 | #199 | Poor 5.4% |
| Immigrants | Zaire | 13.7 /100 | #200 | Poor 5.4% |
| Immigrants | Philippines | 13.5 /100 | #201 | Poor 5.4% |
| Immigrants | Nonimmigrants | 13.1 /100 | #202 | Poor 5.4% |
| Immigrants | Laos | 13.0 /100 | #203 | Poor 5.4% |
| Guamanians/Chamorros | 12.3 /100 | #204 | Poor 5.4% |
| Immigrants | Costa Rica | 11.4 /100 | #205 | Poor 5.5% |
| Immigrants | Ukraine | 9.9 /100 | #206 | Tragic 5.5% |
| Immigrants | Syria | 9.3 /100 | #207 | Tragic 5.5% |
| Immigrants | Lebanon | 8.6 /100 | #208 | Tragic 5.5% |
| Immigrants | Middle Africa | 8.3 /100 | #209 | Tragic 5.5% |
| South American Indians | 7.6 /100 | #210 | Tragic 5.5% |
| Israelis | 7.4 /100 | #211 | Tragic 5.5% |