Spaniard vs Sierra Leonean 9th Grade
COMPARE
Spaniard
Sierra Leonean
9th Grade
9th Grade Comparison
Spaniards
Sierra Leoneans
94.9%
9TH GRADE
59.6/ 100
METRIC RATING
169th/ 347
METRIC RANK
94.8%
9TH GRADE
42.7/ 100
METRIC RATING
181st/ 347
METRIC RANK
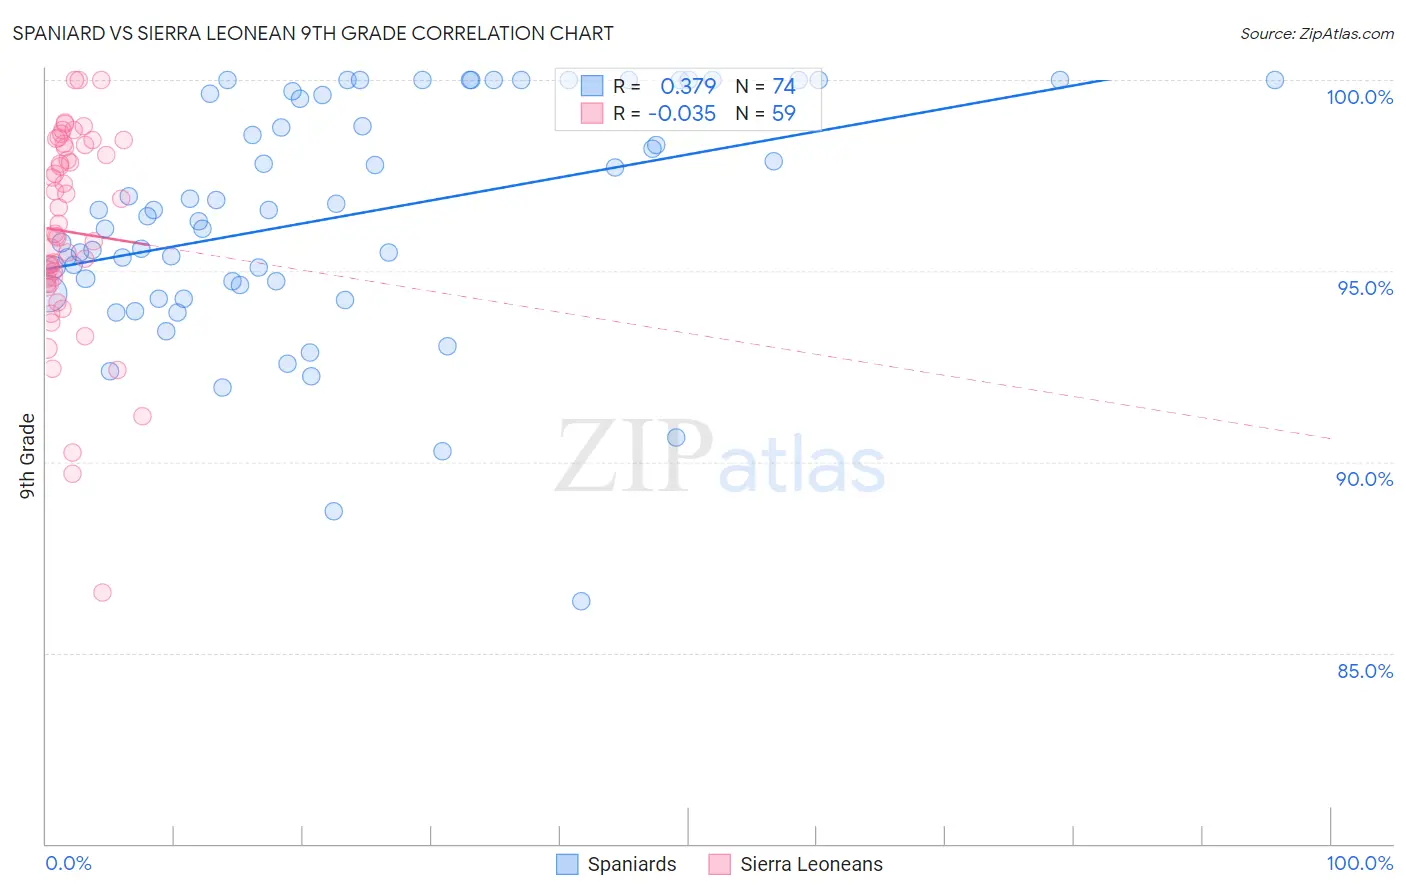
Spaniard vs Sierra Leonean 9th Grade Correlation Chart
The statistical analysis conducted on geographies consisting of 443,543,963 people shows a mild positive correlation between the proportion of Spaniards and percentage of population with at least 9th grade education in the United States with a correlation coefficient (R) of 0.379 and weighted average of 94.9%. Similarly, the statistical analysis conducted on geographies consisting of 83,357,120 people shows no correlation between the proportion of Sierra Leoneans and percentage of population with at least 9th grade education in the United States with a correlation coefficient (R) of -0.035 and weighted average of 94.8%, a difference of 0.13%.
9th Grade Correlation Summary
| Measurement | Spaniard | Sierra Leonean |
| Minimum | 86.4% | 86.6% |
| Maximum | 100.0% | 100.0% |
| Range | 13.6% | 13.4% |
| Mean | 96.4% | 96.0% |
| Median | 96.5% | 96.0% |
| Interquartile 25% (IQ1) | 94.6% | 94.7% |
| Interquartile 75% (IQ3) | 99.6% | 98.3% |
| Interquartile Range (IQR) | 5.0% | 3.6% |
| Standard Deviation (Sample) | 3.1% | 2.7% |
| Standard Deviation (Population) | 3.0% | 2.7% |
Demographics Similar to Spaniards and Sierra Leoneans by 9th Grade
In terms of 9th grade, the demographic groups most similar to Spaniards are Immigrants from Brazil (95.0%, a difference of 0.010%), Chilean (95.0%, a difference of 0.010%), Alsatian (94.9%, a difference of 0.010%), Colville (94.9%, a difference of 0.010%), and Blackfeet (95.0%, a difference of 0.020%). Similarly, the demographic groups most similar to Sierra Leoneans are Immigrants from Uganda (94.8%, a difference of 0.0%), Seminole (94.8%, a difference of 0.0%), Immigrants from Nepal (94.8%, a difference of 0.020%), Immigrants from Poland (94.9%, a difference of 0.030%), and Immigrants from Venezuela (94.9%, a difference of 0.030%).
| Demographics | Rating | Rank | 9th Grade |
| Blackfeet | 62.6 /100 | #165 | Good 95.0% |
| Ute | 62.6 /100 | #166 | Good 95.0% |
| Immigrants | Brazil | 61.1 /100 | #167 | Good 95.0% |
| Chileans | 60.7 /100 | #168 | Good 95.0% |
| Spaniards | 59.6 /100 | #169 | Average 94.9% |
| Alsatians | 58.6 /100 | #170 | Average 94.9% |
| Colville | 58.5 /100 | #171 | Average 94.9% |
| Iraqis | 54.0 /100 | #172 | Average 94.9% |
| Cheyenne | 51.5 /100 | #173 | Average 94.9% |
| Immigrants | Egypt | 50.0 /100 | #174 | Average 94.9% |
| Brazilians | 49.8 /100 | #175 | Average 94.9% |
| Immigrants | Spain | 49.1 /100 | #176 | Average 94.9% |
| Immigrants | Iraq | 47.8 /100 | #177 | Average 94.9% |
| Immigrants | Poland | 46.7 /100 | #178 | Average 94.9% |
| Immigrants | Venezuela | 46.5 /100 | #179 | Average 94.9% |
| Immigrants | Uganda | 43.1 /100 | #180 | Average 94.8% |
| Sierra Leoneans | 42.7 /100 | #181 | Average 94.8% |
| Seminole | 42.5 /100 | #182 | Average 94.8% |
| Immigrants | Nepal | 39.7 /100 | #183 | Fair 94.8% |
| Argentineans | 37.6 /100 | #184 | Fair 94.8% |
| Liberians | 37.4 /100 | #185 | Fair 94.8% |