Spaniard vs Sierra Leonean 7th Grade
COMPARE
Spaniard
Sierra Leonean
7th Grade
7th Grade Comparison
Spaniards
Sierra Leoneans
96.1%
7TH GRADE
62.6/ 100
METRIC RATING
163rd/ 347
METRIC RANK
96.0%
7TH GRADE
37.5/ 100
METRIC RATING
184th/ 347
METRIC RANK
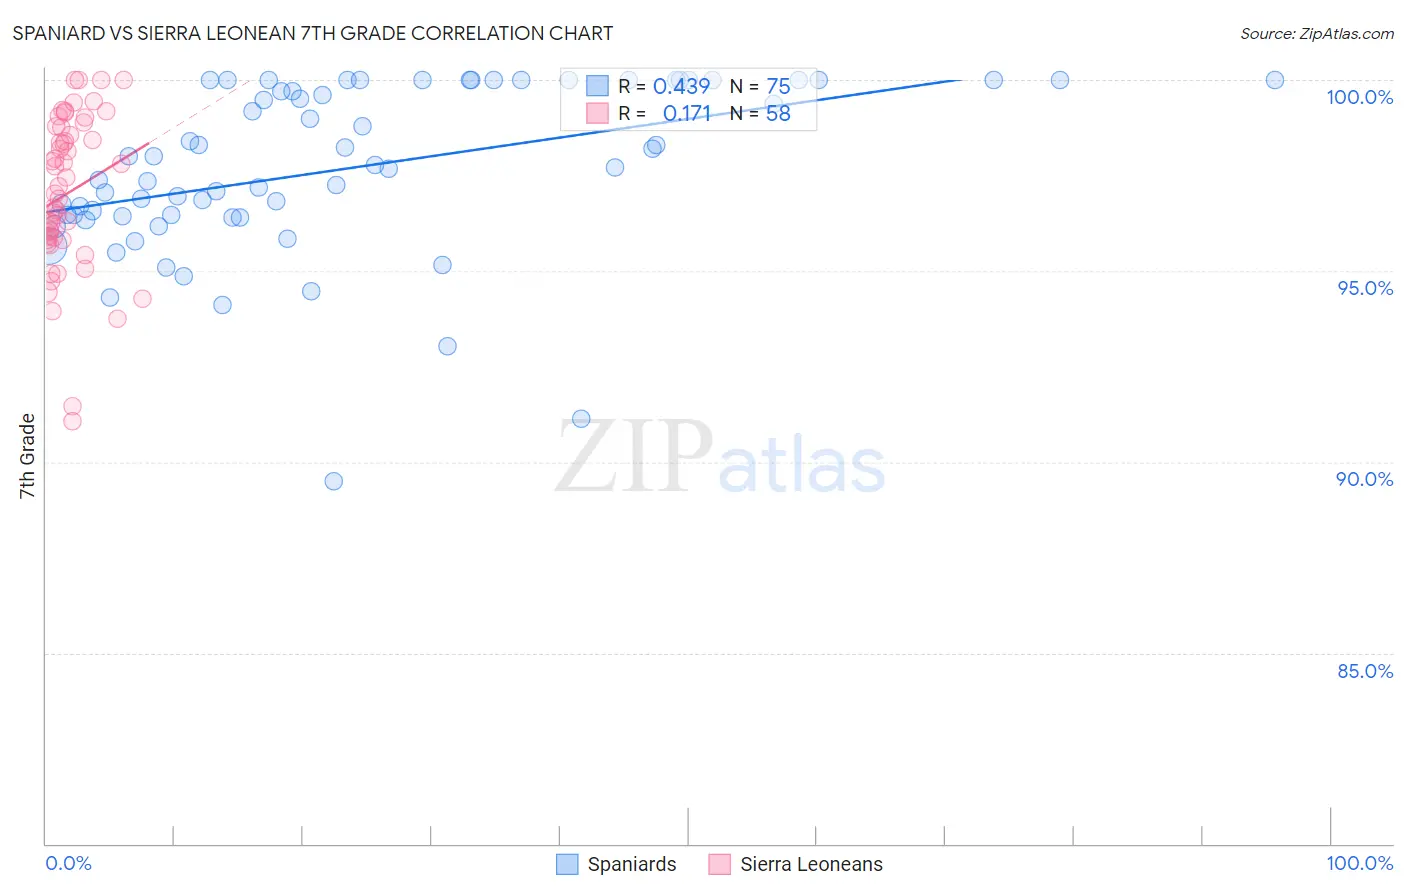
Spaniard vs Sierra Leonean 7th Grade Correlation Chart
The statistical analysis conducted on geographies consisting of 443,544,503 people shows a moderate positive correlation between the proportion of Spaniards and percentage of population with at least 7th grade education in the United States with a correlation coefficient (R) of 0.439 and weighted average of 96.1%. Similarly, the statistical analysis conducted on geographies consisting of 83,337,655 people shows a poor positive correlation between the proportion of Sierra Leoneans and percentage of population with at least 7th grade education in the United States with a correlation coefficient (R) of 0.171 and weighted average of 96.0%, a difference of 0.16%.
7th Grade Correlation Summary
| Measurement | Spaniard | Sierra Leonean |
| Minimum | 89.5% | 91.1% |
| Maximum | 100.0% | 100.0% |
| Range | 10.5% | 8.9% |
| Mean | 97.7% | 97.0% |
| Median | 97.8% | 97.1% |
| Interquartile 25% (IQ1) | 96.4% | 95.8% |
| Interquartile 75% (IQ3) | 100.0% | 98.8% |
| Interquartile Range (IQR) | 3.6% | 2.9% |
| Standard Deviation (Sample) | 2.2% | 2.0% |
| Standard Deviation (Population) | 2.2% | 2.0% |
Similar Demographics by 7th Grade
Demographics Similar to Spaniards by 7th Grade
In terms of 7th grade, the demographic groups most similar to Spaniards are Immigrants from Italy (96.1%, a difference of 0.0%), Pima (96.1%, a difference of 0.010%), Immigrants from Taiwan (96.1%, a difference of 0.010%), Immigrants from Kazakhstan (96.1%, a difference of 0.010%), and Bermudan (96.1%, a difference of 0.020%).
| Demographics | Rating | Rank | 7th Grade |
| Kenyans | 76.2 /100 | #156 | Good 96.2% |
| Ugandans | 75.5 /100 | #157 | Good 96.2% |
| Arabs | 68.6 /100 | #158 | Good 96.2% |
| Alsatians | 67.2 /100 | #159 | Good 96.1% |
| Immigrants | Kenya | 66.8 /100 | #160 | Good 96.1% |
| Bermudans | 66.3 /100 | #161 | Good 96.1% |
| Pima | 64.3 /100 | #162 | Good 96.1% |
| Spaniards | 62.6 /100 | #163 | Good 96.1% |
| Immigrants | Italy | 62.1 /100 | #164 | Good 96.1% |
| Immigrants | Taiwan | 61.5 /100 | #165 | Good 96.1% |
| Immigrants | Kazakhstan | 61.0 /100 | #166 | Good 96.1% |
| Immigrants | Sri Lanka | 59.9 /100 | #167 | Average 96.1% |
| Immigrants | Poland | 59.0 /100 | #168 | Average 96.1% |
| Ute | 55.8 /100 | #169 | Average 96.1% |
| Immigrants | Ukraine | 55.0 /100 | #170 | Average 96.1% |
Demographics Similar to Sierra Leoneans by 7th Grade
In terms of 7th grade, the demographic groups most similar to Sierra Leoneans are Brazilian (96.0%, a difference of 0.0%), Immigrants from Spain (96.0%, a difference of 0.010%), Immigrants from Iraq (96.0%, a difference of 0.010%), Immigrants from Uganda (96.0%, a difference of 0.010%), and Iraqi (96.0%, a difference of 0.020%).
| Demographics | Rating | Rank | 7th Grade |
| Immigrants | Korea | 49.2 /100 | #177 | Average 96.0% |
| Marshallese | 48.4 /100 | #178 | Average 96.0% |
| Immigrants | Iran | 47.8 /100 | #179 | Average 96.0% |
| Immigrants | Brazil | 46.8 /100 | #180 | Average 96.0% |
| Pakistanis | 44.5 /100 | #181 | Average 96.0% |
| Iraqis | 41.2 /100 | #182 | Average 96.0% |
| Immigrants | Spain | 38.8 /100 | #183 | Fair 96.0% |
| Sierra Leoneans | 37.5 /100 | #184 | Fair 96.0% |
| Brazilians | 37.3 /100 | #185 | Fair 96.0% |
| Immigrants | Iraq | 36.1 /100 | #186 | Fair 96.0% |
| Immigrants | Uganda | 36.0 /100 | #187 | Fair 96.0% |
| Immigrants | Egypt | 34.3 /100 | #188 | Fair 95.9% |
| Immigrants | Venezuela | 33.9 /100 | #189 | Fair 95.9% |
| Immigrants | Micronesia | 32.6 /100 | #190 | Fair 95.9% |
| Liberians | 32.5 /100 | #191 | Fair 95.9% |